Introduction to Errors and Debugging
Introduction to Errors and Debugging
Errors in a Program
Introduction
Apparently no matter how careful and meticulous you are, there will be errors in your program. When, not if, they occur, you should be able to address the issue. In most cases, both C# and Microsoft Visual Studio can assist you.
The errors your program will encounter can be classified in three categories: runtime, syntax, and logic errors. We will study runtime errors in the next two lessons about exception handling.
![]() Practical Learning: Introducing Errors
Practical Learning: Introducing Errors
A syntax error is due to a misuse of the C# language in your code. For example, in Lesson 2, we saw that, on one hand C# is case-sensitive and, on the other C# has a set of keywords that you should (must) not use to name your variables. The first rule can be difficult to observe if you come from a case-insensitive language like Pascal or Visual Basic. It can also happen through distraction. The second rule is easy to observe if you have used another C-based language such as C++ or Java. Both rules are easy to violate if you write your code using a normal text editor like Notepad.
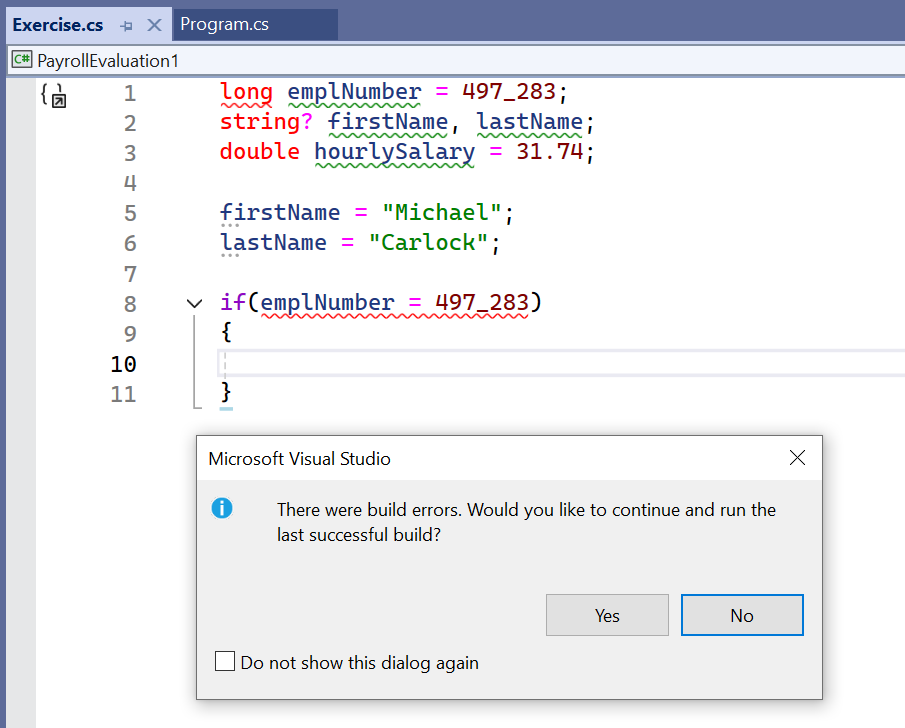
Fortunately, the built-in Code Editor of Microsoft Visual Studio makes it extremely easy to be aware of syntax errors as soon as they occur:
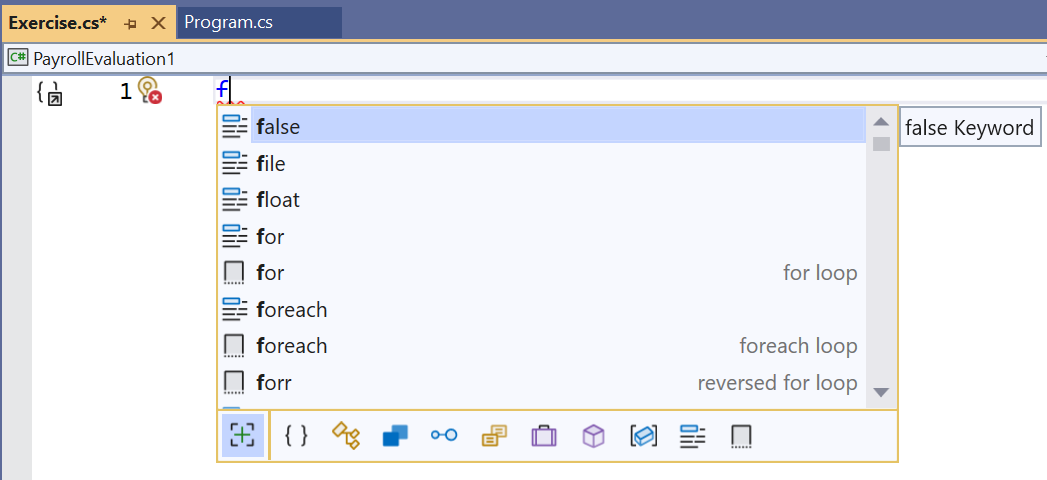
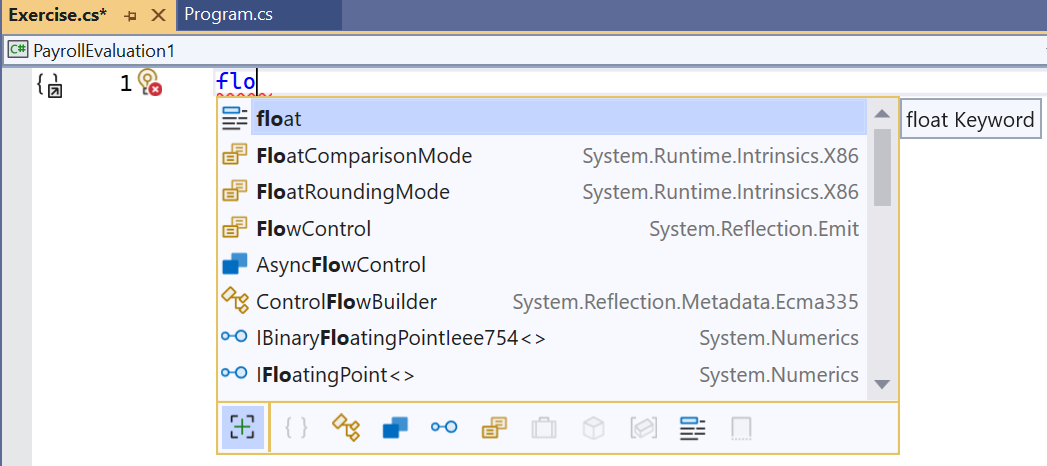
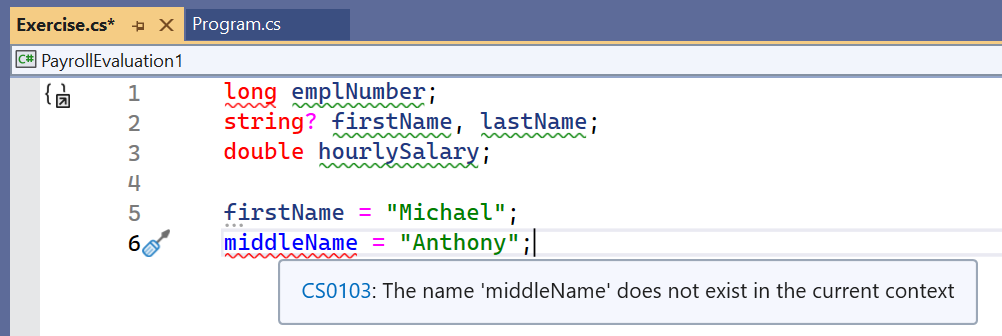
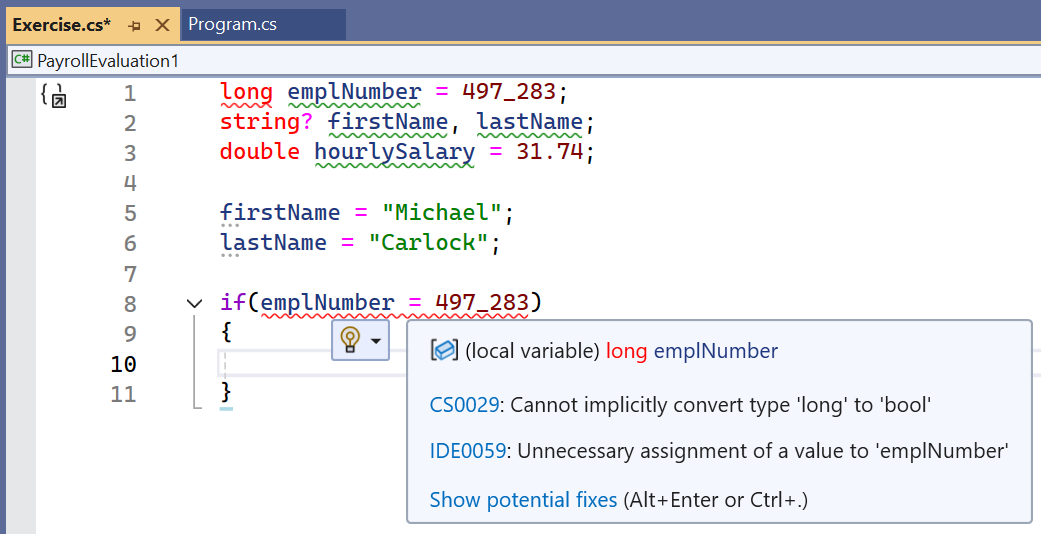
As you can see, if you create your application in Microsoft Visual Studio, the Code Editor is fully equipped with tools to assist you to detect and correct syntax errors. If you still violate a syntax rule, when you build your project, the compiler would detect the error and point out the line, the section, and the file name where the error occurred. Here is an example:
![]() Practical Learning: Introducing Syntax Errors
Practical Learning: Introducing Syntax Errors
using static System.Console;

double principal = 0.00d;

Title = "Watts A Loan?";

WriteLine("============================");
WriteLine("Loan Summary");
WriteLine("=--------------------------=");
WriteLine("Principal:       {0:F}", principal);
WriteLine("============================");
Logic Errors
A logic error occurs when the program (the code) is written fine but the result it produces is not reliable. With a logic error, the Code Editor does not see anything wrong in the document and therefore cannot point out a problem. One of the worse types of logic errors is one that makes a computer crash sometimes, regularly, or unpredictably, while there is nothing obviously wrong in the code.
Logic errors are, or can be, difficult to spot because you will have to know for sure that the result is wrong and why (and sometimes worse, you will have to agree or accept that it is your program that is causing a problem in the computer: a bitter pill to swallow; imagine a user reports that her computer crashes every time she starts the application you created). Because you or the user of your program would know with certainty that the result is questionable, you would have to use some means of correcting it. One of the techniques you can use is referred to as debugging.
Debugging Fundamentals
Introduction
A logic error is called a bug. Debugging is the process of examining code to look for bugs or to identify problems. Debugging is the ability to monitor the behavior of a variable, a class, or its members throughout a program. Microsoft Visual Studio provides many features to perform debugging operations.
The debugger is the program you use to debug your code. The code or application that you are debugging is called the debuggee.
Probably the most fundamental way of examining code is to read every word and every line, with your eyes, using your experience as a programmer. This can work for short code written in one file and in one class. If the code to examine covers many pages or many files, it could be aweful and tiresome to examine code with your eyes line by line. Fortunately, to assist you with this operation, Microsoft Visual Studio provides various tools and windows you use, one window, or a combination of objects. One of the tools you can use is the Standard toolbar that is equipped with various debugging buttons:
Starting and Continuing With Debugging
There are different ways you can launch the debugging process:
In later sections, we will see other ways of starting or proceeding with debugging. In some cases, we will see how you can suspend debugging. When this has happened, to resume debugging:
We will see other ways of continuing with debugging.
Stopping the Debugging
As we will see in later sections, there are various debugging approaches available in Microsoft Visual Studio. Sometimes you will want to suspend or stop debugging.
To end debugging at any time:
The Locals Window
One of the primary pieces of information you want to get is the value that a variable is holding. A window named Locals is used to show that value. Normally, when you start debugging, the Locals window shows automatically. During debugging, if the Locals window is hidden, to display it:
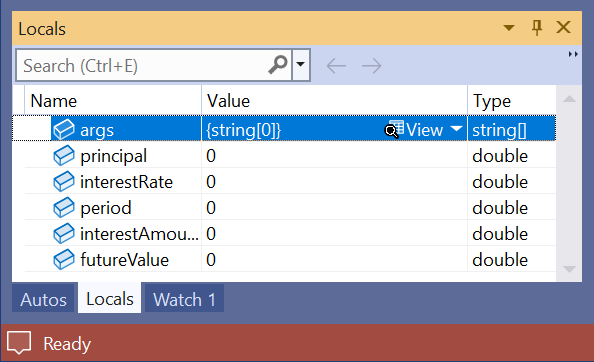
As its name indicates, the Locals window shows the values of local variables as they are changed. If there is more than one variable, the Locals window displays their names and gives a row to each variable. The Locals window organizes its information in a table or grid:

The Name column shows the name of each variable declared in the function or the section that is being debugged. Imagine that the variable is a structure, a record, or a class. Here are examples:
using static System.Console;

Square sqr = new();
Rectangle rect = new(496.84, 825.97);

sqr.Side = 927.93;

WriteLine("Geometry - Square");
WriteLine("----------------------------");
WriteLine($"Side:      {sqr.Side}");
WriteLine($"Perimeter: {sqr.Perimeter}");
WriteLine($"Area:      {sqr.Area}");
WriteLine("============================");
WriteLine("Geometry - Rectangle");
WriteLine("----------------------------");
WriteLine($"Width:     {rect.Width}");
WriteLine($"Height:    {rect.Height}");
WriteLine($"Perimeter: {rect.CalculatePerimeter()}");
WriteLine($"Area:      {rect.CalculateArea()}");
WriteLine("============================");

// A Structure
internal record struct Square
{
    public double Side { get; set; }

    public double Perimeter
    {
        get
        {
            return Side * 4.00;
        }
    }

    public double Area
    {
        get
        {
            return Side * Side;
        }
    }
}

public class Rectangle
{
    public Rectangle(double width, double height)
    {
        (Width, Height) = (width, height);
    }

    public double Width  { get; init; }
    public double Height { init; get; }

    public double CalculatePerimeter()
    {
        return (Width * Height) * 2.00;
    }

    public double CalculateArea()
    {
        return Width * Width;
    }
}
In this case, when debugging, in the Locals window, an arrow icon would appear to its left, indicating that it has properties:
In this case, to show the variables, that is, to expand the node, click the arrow icon. This would show the fields under the variable name and the name of the class between curly brackets under the Value column:
The Value columns shows the value of each variable. When debugging starts, each variable shows its default or initial value. As debugging progresses, when a variable acquires a new value, the Locals window updates it in the Value column. In some cases, instead of the debugger changing the value, you can manually select and change it in the Locals window and press Enter.
The Type column shows the data type of the variable. If the variable is a class, the name of the class shows in the Type column.
Debugging Statements
Executing One Statement at a Time
Just as done when reading code with your eyes, the most basic way to monitor code is to execute one line at a time and see the results displayed before your eyes. To support this operation, the debugger provides what is referred to as stepping into.
To execute code one line at a time, while the file that contains it is displaying:
When code is being stepped into, the margin corresponding to the line that is being examined displays a right-pointing yellow arrow:
This lets you know what line is currently considered.
![]() Practical Learning: Examining Local Variables
Practical Learning: Examining Local Variables
using static System.Console;

double principal;
double interestRate;
double period;
double interestAmount;
double futureValue;

Title = "Watts A Loan?";

Console.WriteLine("This application allows you to evaluate a loan");
WriteLine("To proceed, enter the following values");

Write("Enter the principal: ");
principal = double.Parse(ReadLine()!);
Write("Enter the interest rate: ");
interestRate = double.Parse(ReadLine()!) / 100;
Write("Enter the number of months: ");
period = double.Parse(ReadLine()!) / 12;

interestAmount = principal * interestRate * period;
futureValue    = principal + interestAmount;

Clear();

WriteLine("============================");
WriteLine("Loan Summary");
WriteLine("=--------------------------=");
WriteLine("Principal:       {0:F}", principal);
        Console.WriteLine("Interest Rate:   {0:P}", interestRate);
WriteLine("Period For:      {0} months", period * 12);
WriteLine("Interest Amount: {0:F}", interestAmount);
WriteLine("Future Value:    {0:F}", futureValue);
WriteLine("============================");
============================
Loan Summary
=--------------------------=
Principal:       6500.00
Interest Rate:   12.65 %
Period For:      36 months
Interest Amount: 2466.75
Future Value:    8966.75
============================
Executing One Method at a Time
The Step Into feature is a good tool to monitor the behavior of variables inside a method. This also allows you to know if a method is behaving as expected. Once you have established that a method is alright, you may want to skip it. Instead of executing one line at a time, the debugger allows you to execute a whole method at a time or to execute the lines in some methods shile skipping the others. To support this, you use a feature named Step Over.
To step over a method, while debugging:
As its name suggests, the Step Over feature allows you to skip a method if you know it doesn't have any problem. When debugging, you choose what methods to step into and which ones to step over.
![]() Practical Learning: Stepping Over
Practical Learning: Stepping Over
using static System.Console;

double GetPrincipal()
{
    double value = 0.00D;

    Write("Enter the principal: ");
    value = double.Parse(ReadLine()!);

    return value;
}

double GetInterestRate()
{
    double value = 0.00D;

    Write("Enter the interest rate: ");
    value = double.Parse(ReadLine()!);

    return value;
}

double GetPeriods()
{
    double value = 0;

    Console.Write("Enter the number of months: ");
    value = double.Parse(ReadLine()!);

    return value;
}

void ShowLoanSummary(double presentValue,
                     double annualRate,
                     double periods,
                     double interestCollected,
                     double totalCollected)
{
    WriteLine("============================");
    WriteLine("Loan Summary");
    WriteLine("=--------------------------=");
    WriteLine("Principal:       {0:F}", presentValue);
    WriteLine("Interest Rate:   {0:P}", annualRate);
    WriteLine("Period For:      {0} months", periods * 12);
    WriteLine("Interest Amount: {0:F}", interestCollected);
    WriteLine("Future Value:    {0:F}", totalCollected);
    WriteLine("============================");
}

double principal;
double interestRate;
double period;
double interestAmount;
double futureValue;

Title = "Watts A Loan?";

WriteLine("This application allows you to evaluate a loan");
WriteLine("To proceed, enter the following values");

principal = GetPrincipal();
interestRate = GetInterestRate() / 100;
period = GetPeriods() / 12;

interestAmount = principal * interestRate * period;
futureValue = principal + interestAmount;

Clear();

ShowLoanSummary(principal, interestRate, period, interestAmount, futureValue);using static System.Console;
double principal;
double interestRate;
double period;
double interestAmount;
double futureValue;
Title = "Watts A Loan?";
WriteLine("This application allows you to evaluate a loan");
WriteLine("To proceed, enter the following values");
principal = GetPrincipal();
interestRate = GetInterestRate() / 100;
period = GetPeriods() / 12;
interestAmount = principal * interestRate * period;
futureValue = principal + interestAmount;
Clear();
ShowLoanSummary(principal, interestRate, period, interestAmount, futureValue);
double GetPrincipal()
{
double value = 0.00D;
Write("Enter the principal: ");
value = double.Parse(ReadLine()!);
return value;
}
double GetInterestRate()
{
double value = 0.00D;
Write("Enter the interest rate: ");
value = double.Parse(ReadLine()!);
return value;
}
double GetPeriods()
{
double value = 0;
Console.Write("Enter the number of months: ");
value = double.Parse(ReadLine()!);
return value;
}
void ShowLoanSummary(double presentValue,
double annualRate,
double periods,
double interestCollected,
double totalCollected)
{
WriteLine("============================");
WriteLine("Loan Summary");
WriteLine("=--------------------------=");
WriteLine("Principal: {0:F}", presentValue);
WriteLine("Interest Rate: {0:P}", annualRate);
WriteLine("Period For: {0} months", periods * 12);
WriteLine("Interest Amount: {0:F}", interestCollected);
WriteLine("Future Value: {0:F}", totalCollected);
WriteLine("============================");
}Running to a Point
Introduction
When executing a program, you can specify a section or line where you want the execution to pause, for any reason you judge necessary. This approach is useful if you have checked code up to a certain point and it looked alright. If you are not sure about code starting at a certain point, this can be your starting point.
To execute code up to a certain point
![]() Practical Learning: Running to a Point
Practical Learning: Running to a Point
| Customer Name: | Steve Longley |
| Customer Phone: | 301-208-2333 |
| Order Date: | 10/08/2014 |
| Order Time: | 08:14 AM |
| Number of Shirts: | 5 |
| Number of Pants: | 2 |
| Number of Other Items: | 8 |

====================================
-/- Georgetown Cleaning Services -/-
====================================
Customer:    Steve Longley
Home Phone:  301-208-2333
Order Date:  Wednesday, October 08, 2014
Order Time:  8:14 AM
------------------------------------
Item Type  Qty Unit/Price Sub-Total
------------------------------------
Shirts      5      0.95      4.75
Pants       2      2.95      5.90
Others      8      4.55     36.40
------------------------------------
Total Order:   47.05
Tax Rate:      5.75 %
Tax Amount:    2.71
Net Price:     49.76
------------------------------------
Amount Tended: 60.00
Difference:    10.24
====================================
Breakpoints
A breakpoint on a line is the code where you want the exection to suspend. You must explicitly specify that line by creating a breakpoint. You can as well create as many breakpoints as you want. You can also remove a breakpoint you don't need anymore.
To create a breakpoint, first identify the line of code where you want to add it. Then:
A breakpoint is represented by a red circular button ![]() . After creating a breakpoint, when code executes and reaches that line, it would pause and let you know by drawing a right-pointing yellow button
. After creating a breakpoint, when code executes and reaches that line, it would pause and let you know by drawing a right-pointing yellow button ![]() .
.
After using a breakpoint, you can remove it. To delete a breakpoint:
Remember that you can create more than one breakpoint. If you have more than one breakpoint in your code, execution would pause at each one of them. At any time, you can remove one or all breakpoints. To delete all breakpoints, on the main menu, click Debug -> Delete all Breakpoints.
![]() Practical Learning: Using Breakpoints
Practical Learning: Using Breakpoints

| Customer Name: | Hermine Simms |
| Customer Phone: | 410-573-2031 |
| Order Date: | 10/08/2014 |
| Order Time: | 09:22 AM |
| Number of Shirts: | 3 |
| Number of Pants: | 3 |
| Number of Other Items: | 12 |


| Customer Name: | Ginette Rhoads |
| Customer Phone: | 301-217-9494 |
| Order Date: | 11/06/2014 |
| Order Time: | 02:07 PM |
| Number of Shirts: | 0 |
| Number of Pants: | 2 |
| Number of Other Items: | 0 |
| Order Time: | 14:07 |
Stepping to Breakpoints
You can combine the Step Into and/or the Step Over feature with breakpoints. That is, you can examine each code line after line until you get to a specific line. This allows you to monitor the values of variables and see their respective values up to a critical section. To do this, first create one or more breakpoints, then proceed with steps of your choice.
![]() Practical Learning: Stepping to Breakpoints
Practical Learning: Stepping to Breakpoints

====================================
-/- Georgetown Cleaning Services -/-
====================================
Customer:    James Sandt
Home Phone:  301-870-7454
Order Date:  Friday, October 10, 2014
Order Time:  6:02 PM
------------------------------------
Item Type  Qty Unit/Price Sub-Total
------------------------------------
Shirts      2      0.95      1.90
Pants       8      2.95     23.60
Others     12      4.55     54.60
------------------------------------
Total Order:   80.10
Tax Rate:      5.75 %
Tax Amount:    4.61
Net Price:     84.71
------------------------------------
Amount Tended: 80.00
Difference:    -4.71
====================================
|
|
|||
| Previous | Copyright © 2001-2025, FunctionX | Friday 15 October 2021 | Next |
|
|
|||