Grouping Records on a Report
 |
Grouping Records on a Report |
Introduction to Grouping Records
Overview
Consider the following table that represents a list of students:

When creating this type of table, you may have values that can be considered in categories, such as sold and unsold items, discounted and not discounted items, or males and females. When preparing a report, you can show its records by each category. For example, on a table of students, you can show the list of girls only first. Then, after the group of girls, you would show the list of boys. This is referred to as grouping the records.
![]() Practical Learning: Introducing Groups
Practical Learning: Introducing Groups
Creating a Group Header
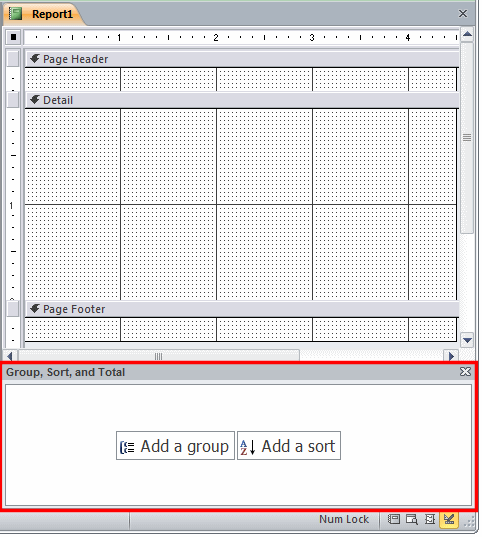
To create a group of records on a report, you have various options. You can let the Report Wizard assist you or you can work manually. If you want to create the group yourself, first open the report in Design View and specify, or make sure, its Record Source has a table. Then:
This would add a new section titled Group, Sort, and Total under the report:

At any time, to close the Grouping window, you can click its Close button.
One of the buttons in the new section is titled Add a Group. To create a new group, click that button. This would change the contents of the window and display a new button with a popup window that shows the fields of the table specified as the Record Source:

From the popup window, you can click the name of the field you want to use as the group leader. Here is an example:

This would add a new bar and section to the report above the Detail bar. The bar of the new section would display the name of the field followed by Header. Here is an example:

Also, under the report, the contents of the Group, Sort, and Total window would be changed into a new bar that displays the name of the field that was selected.
![]() Practical Learning: Creating a Group
Practical Learning: Creating a Group
Designing a Group
After creating a group, you can add, or continue to add, the fields to the report. One of the most important, but not required, aspects of design is that you should add the field that holds the same name to the new section:

That way, when the report prints, the name of the group would show before the related records: remember that the report bars do not show on the printed paper. After adding the field in its section, you can add, or you can continue adding, the other fields. Those other fields should be added to the Detail section or the section under the group header. If you include their labels, these labels would show for each field:


This can appear unprofessional or redundant to some eyes. A better alternative is to put the labels of those child fields in the section of the group header, and put the controls in the section under the group leader. Here is an example:


Notice that, by default, the Detail section repeats to show each record related to the group leader. Therefore, another aspect of design is that you should provide room only as much as necessary for each related record. Here is an example:

Then, when the report displays or when it prints, all related records would show appropriately:

Still, if each record has some detail, such as a comment or a calculation you want to add, you can/should include it in the Detail section, probably under the other fields.
![]() Practical Learning: Designing a Group
Practical Learning: Designing a Group

Adding a Sub-Group to a Group
Consider the following list of students:

In a certain table, you may have records that can be categorized. Then, inside of each category, there may be a sub-category. When creating a report for such a table, you can create one group, then create another group inside of that group.
You start the report as we described so far: display it in Design View and specify its Record Source. You also start the grouping as we saw above. In the Group, Sort, and Total window, click the Add a Group button and select the primary group. Here is an example:

As mentioned already, a bar would be added to the Group, Sort, and Total section. Under that bar, there would be a new Add a Group button and a dotted curved line joining them:

To create a sub-group, you can click the Add a Group button to display the list of fields and click a field from that list:

A new section would be added under the main one and it would have the same name of the field that was added, followed by Header:

Notice that under the report, a bar for the new group is added and it has its own Add a Group button, which indicates that, if necessary, you can create another sub-section. You can continue the same approach to create as many sub-sections as you judge necessary.
When designing the report, in the main section, you should add only its own field. In the group under it, you should add the field of that group and the labels of the related records if that section does not have its own sub-group. Then, in the Detail section, add the last fields of the grouping:


Removing a Group
If you have a group you do not like on a report, you can get rid of it. To remove one group, under the report, click the Delete button that corresponds to it. You would receive a warning so you can make your final decision. If you delete a sub-group, only its section would be removed from the report. If you delete a group that has one or more sub-groups, its section and its sub-sections would be removed from the report.
The Characteristics of a Group
Forcing a New Page
When creating a report, you add the fields of the records as you see fit in the desired sections and groups. As seen with the Keep Together Boolean property, you can exercise some control on how many records print on one page based on the number of fields of each record. We saw that if many records could fit on one page, then they would be grouped on that one page. In some cases, you may want each record on its own page, even if the record has only a few values, even if many records can fit on one page. Displaying each record on its own page is referred to as forcing a new page.
The ability to force each record on its own page is controlled by the Force New Page enumerated property. To use it, access the Property Sheet for a section or group. From the Format or the All tab, click Force New Page, and click the arrow of its combo box to display the list of options:
 |
 |
 |
![]() Practical Learning: Creating a Catalogue
Practical Learning: Creating a Catalogue
 |
 |
 |
 |
Lesson Summary
Exercises
Yugo National Bank
Watts A Loan
World Statistics
US Senate