 |
C# Errors & Exceptions: Options on Debugging |
|
|
Debugging and Separate Files |
|
|
|
As you know already, a program can use many files, some
files come from the .NET Framework, some are created by Microsoft Visual
Studio when you start a project, and you create the others as you judge them
necessary for your project. As a result, when debugging, you can consider
files that are linked at one time or another. The process of debugging is
primarily the same. You just have to keep in mind that you are dealing with
many classes and probably different files. This has some consequences on the
results you see.
|
|
 Application:
Debugging With a Class Application:
Debugging With a Class
|
|
- Start Microsoft Visual C#
- To start a new project, on the main menu, click File -> New Project
- In the middle list, click Empty Project
- Change the Name to WattsALoan2
- Click OK
- To create a file, in the Solution Explorer, right-click WattsALoan2
-> Add -> New Item...
- In the middle list, click Code File
- Change the Name to Customer and press Enter
- In the empty document, type the following:
public class Customer
{
    public string FullName;
    public string PhoneNumber;

    public Customer(string name = "John Doe", string phone = "000-000-0000")
    {
        FullName = name;
        PhoneNumber = phone;
    }
}
- To create a file, in the Solution Explorer, right-click WattsALoan2
-> Add -> New Item...
- In the middle list, click Code File
- Change the Name to Employee and press Enter
- In the empty document, type the following:
public class Employee
{
    public long EmployeeNumber;
    public string FirstName;
    public string LastName;
    public string Title;

    public Employee(long emplNbr = 0,
                    string fName = "Unknown",
                    string lName = " Not Specified",
                    string position = "Loan Specialist")
    {
        EmployeeNumber = emplNbr;
        FirstName = fName;
        LastName = lName;
        Title = position;
    }

    public string GetEmployeeName()
    {
        return LastName + ", " + FirstName;
    }
}
- To add a new file to the project, on the main menu, click Project ->
Add New Item...
- In the middle list, click Code File
- Change the Name to LoanInformation
- Click Add
- In the empty document, type the following:
public class LoanInformation
{
    public double Principal;
    public double InterestRate;
    public double Period;
    public double InterestAmount;
    public double FutureValue;
}
- To create a new file, on the main menu, click Project -> Add New
Item...
- In the middle list, click Code File
- Change the Name to LoanEvaluation
- Click Add
- In the empty document, type the following:
using System;

public class LoanEvaluation
{
    private Employee clerk;
    private Customer client;
    private LoanInformation loan;

    public LoanEvaluation()
    {
        clerk = new Employee();
        client = new Customer();
        loan = new LoanInformation();
    }

    private void IdentifyEmployee()
    {
        Console.WriteLine("Enter the following pieces of information " +
                          "about the employee who prepared this loan.");
        Console.Write("Employee #: ");
        clerk.EmployeeNumber = long.Parse(Console.ReadLine());
        Console.Write("First Name: ");
        clerk.FirstName = Console.ReadLine();
        Console.Write("Last Name:  ");
        clerk.LastName = Console.ReadLine();
        Console.Write("Title:      ");
        clerk.Title = Console.ReadLine();
    }

    private void IdentifyCustomer()
    {
        Console.WriteLine("Enter the following pieces of information " +
                          "about the customer for whom this loan was prepared.");
        Console.Write("Customer Name: ");
        client.FullName = Console.ReadLine();
        Console.Write("Phone Number:  ");
        client.PhoneNumber = Console.ReadLine();
    }

    private void GetLoanValues()
    {
        Console.WriteLine("Enter the following pieces of information " +
                          "about the values used for the loan.");

        Console.Write("Enter the principal: ");
        loan.Principal = double.Parse(Console.ReadLine());

        Console.Write("Enter the interest rate: ");
        loan.InterestRate = double.Parse(Console.ReadLine()) / 100;

        Console.Write("Enter the number of months: ");
        loan.Period = double.Parse(Console.ReadLine()) / 12;
    }

    public void Show()
    {
        loan.InterestAmount = loan.Principal * loan.InterestRate * loan.Period;
        loan.FutureValue = loan.Principal + loan.InterestAmount;

        Console.WriteLine("======================================");
        Console.WriteLine("Loan Summary");
        Console.WriteLine("=------------------------------------=");
        Console.WriteLine("Prepared by:  {0} - {1}\n              {2}",
                          clerk.EmployeeNumber,
                         clerk.GetEmployeeName(), clerk.Title);
        Console.WriteLine("=------------------------------------=");
        Console.WriteLine("Prepared for: {0}\n              {1}",
                          client.FullName, client.PhoneNumber);
        Console.WriteLine("=------------------------------------=");
        Console.WriteLine("Principal:       {0:F}", loan.Principal);
        Console.WriteLine("Interest Rate:   {0:P}", loan.InterestRate);
        Console.WriteLine("Period For:      {0} months", loan.Period * 12);
        Console.WriteLine("Interest Amount: {0:F}", loan.InterestAmount);
        Console.WriteLine("Future Value:    {0:F}", loan.FutureValue);
        Console.WriteLine("======================================");
    }
}
Instead of just one class or one file, we have learned,
and will continue learning, that, to organize your project, you can create
the classes of your project in different files. When you debug a project
that uses different classes or files that contain classes, the debugger is
aware of the objects and where they are created. As we will learn later,
there are various windows that assist you with identifying the objects of
your project. As a result, the tools such as the Locals window display their
contents accordingly.
As you know already, the starting point of a C#
application is the Main() function (in C#, that would be a
class that contains a method named Main). If you start
debugging an application that uses many code files (files that contain
classes), the debugger must first identify the file that contains the
Main() function. If you are debugging a normal console
application but the debugger cannot find a file that contains the
Main() function, you would receive an error, indicating that your
project does not contain an entry point.
|
 Application:
Debugging Classes Application:
Debugging Classes
|
|
- On the main menu, click Debug -> Step Into. Notice that you receive
an error:
Error	1  Program '. . .\WattsALoan2\WattsALoan2\obj\x86\Debug\WattsALoan2.exe'
does not contain a static 'Main' method suitable for an entry point WattsALoan2
- Change the LoanEvaluation.cs file as follows:
using System;

public class LoanEvaluation
{
    . . . No Change

    public static int Main()
    {
        LoanEvaluation evaluation = new LoanEvaluation();

        Console.Title = "Watts A Loan?";

        Console.WriteLine("This application allows you to evaluate a loan");
        evaluation.IdentifyEmployee();
        evaluation.IdentifyCustomer();

        Console.Clear();

        evaluation.GetLoanValues();

        Console.Clear();

        evaluation.Show();

        System.Console.ReadKey();
        return 0;
    }
}
- To restart debugging, press F8.
If you don't see the Locals
window, to display it, on the main menu, click Debug -> Window -> Locals
- Move the windows to make sure you can see the Code Editor, the
Locals window, and the DOS window
- Notice that the debugging yellow arrow indicator is positioned on
the left of the opening curly bracket of the Main() function.
Notice
that at this time, the Locals window contains only the evaluation
variable whose value is null.
At this time, the DOS window shows a
blinking caret
- To continue debugging, on the main menu, click Debug -> Step Into
- Again, on the main menu, click Debug -> Step Into.
Notice that
the debugger is in the LoanEvaluation.cs file and to its constructor
- In the Locals window, click the + button of this to expand it.
Notice that it show the global variables of the class
- To continue debugging, on the Standard toolbar, click the Step Into
button
 three times.
Notice that the excution switches to the constructor of
the Employee class in the Employee.cs file
- In the Locals window, click the + button of this to expand
- To continue debugging, press F8 seven times.
The debugging
returns to the LoanEvaluation.cs file and focuses on the clerk variable
that is of type Employee
- On the Standard toolbar, click the Step Into button
 . .
The debugging moves to the constructor of the Customer class in the
Customer.cs file
- Press F8 six times.
The debugging returns to the client variable
in the LoanEvaluation.cs file
- Press F8 three times.
The debugging returns to the evaluation
variable in the Main() function
- Press F8 twice
Notice that the title bar of the DOS window has
changed
- In the Locals window, click all the + buttons to show the current
values of the variables for the Employee, the Customer, and the
LoanInformation variables
- Keep pressing F8 until the title bar of the DOS window indicates
that it has focus and you are asked to enter an employee number
- When asked for an employee number, type 20584 and
press Enter
- The focus moves back to the Code Editor.
Notice that the value of
the employee number has changed in the Locals window
Press F8 twice.
The focus moves back to the DOS window
- For the First Name, type Joshua and press Enter
- The focus moves back to the Code Editor.
Press F8 twice.
The
focus moves back to the DOS window
- For the Last Name, type Mahmouda and press Enter
- The focus moves back to the Code Editor.
Press F8 twice.
The
focus moves back to the DOS window
- For the Title, type Account Representative and
press Enter
- The focus moves back to the Code Editor.
Press F8 seven times.
The focus moves back to the DOS window
- When asked to provide a customer name, type Lauren Sachs
and press Enter
- The focus moves back to the Code Editor.
Press F8 twice.
The
focus moves back to the DOS window
- For the Phone Number, type (301) 438-6243 and press
Enter
- The focus moves back to the Code Editor.
Press F8 many times
until the DOS window receives focus
- value for the principal, type 24750 and press Enter
- The focus moves to the Code Editor.
Notice that the value of the
principal has changed in the Locals grid.
Press F8
- Press F8 again
- When the focus moves to the DOS window, when you are asked to
provide the interest rate, type 11.35 and press Enter
- Press F8
- Press F8 again
- The focus moves to the DOS window.
For the number of months, type
60 and press Enter
- Keep pressing F8.
Observe the values in the Locals window and see
the new lines in the DOS window
- Continue pressing F8 until the DOS window closes
- Make sure the LoanEvaluation.cs file is displaying.
Click the
margin on the left side of loan.FutureValue = loan.Principal +
loan.InterestAmount;
- On the main menu, click Window -> Employee.cs
- Click the margin on the left site of return LastName + ", " +
FirstName;
- On the main menu, click Debug -> Start Debugging
- In the DOS window, enter the values as follows and press Enter after
each
| Employee #: |
41920 |
| First Name: |
Donna |
| Last Name: |
Jones |
| Title: |
Account Manager |
| Customer Name: |
Hermine Simms |
| Customer Phone: |
410-573-2031 |
| Principal: |
3250 |
| Number of Months: |
36 |
The focus moves to the LoanEvaluation.cs file in the Code Editor
- Press F5 to continue.
Debugging switches to the Employee.cs file
- Press F5 to see the result in the DOS window
- On the main menu, click File -> Close Solution
- When asked whether you want to save, click Discard
You are probably familiar with the Error List window
because if you have ever made any mistake in your code, it would come up.
The Error List is a window that displays the list of the current errors in
your code. Most of the times, the Error List is present, usually below the
Code Editor. At any time, to display it, on the main menu, you can click
View -> Error List or press Ctrl + W. While you are working on your code,
the Error List may be minimized. To permanently keep it showing, you can
click its AutoHide button.
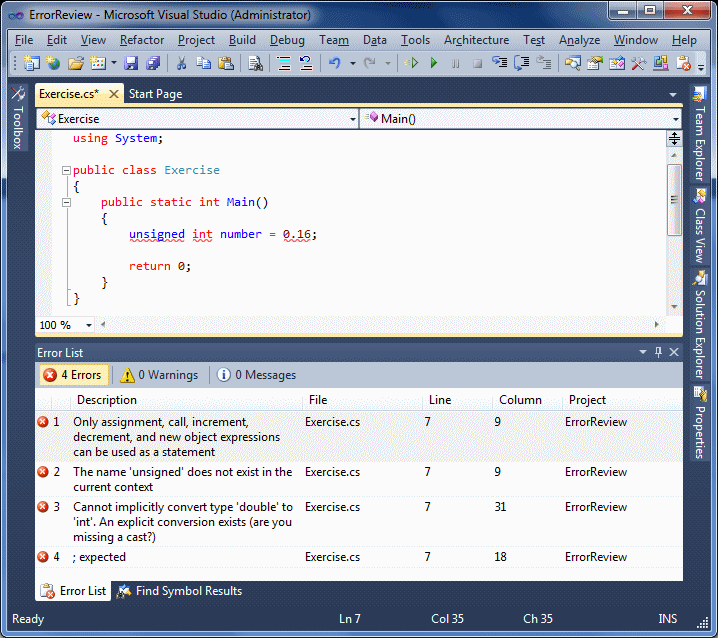
The Error List uses two sequences of how it decides to
show the errors. While writing your code, if the live parser, which
continuously runs while you are writing your code, finds a problem, it makes
a list of all types of violations, even if there is only one mistake, or
there appears to be only one mistake. It shows the list in a table:

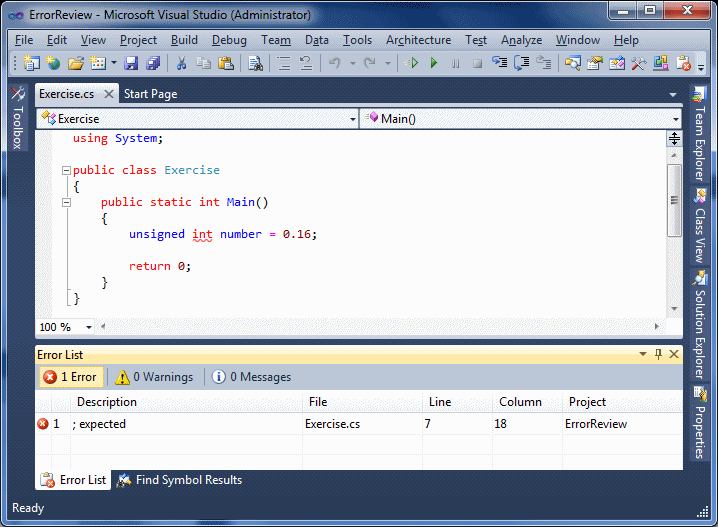
Another sequence, or a different list, gets created if
you build your code. This time, it is the debugger's list that would show:

It is important to know that one mistake could be
violating more than one rule of the C# language.
As seen in our introduction to
syntax errors, if
you are using Microsoft Visual C# (whether Microsoft Visual C# 2010 Express
or Microsoft Visual Studio), while you are writing your code, if the parser
senses a problem, it underlines the section in the Code Editor and the Error
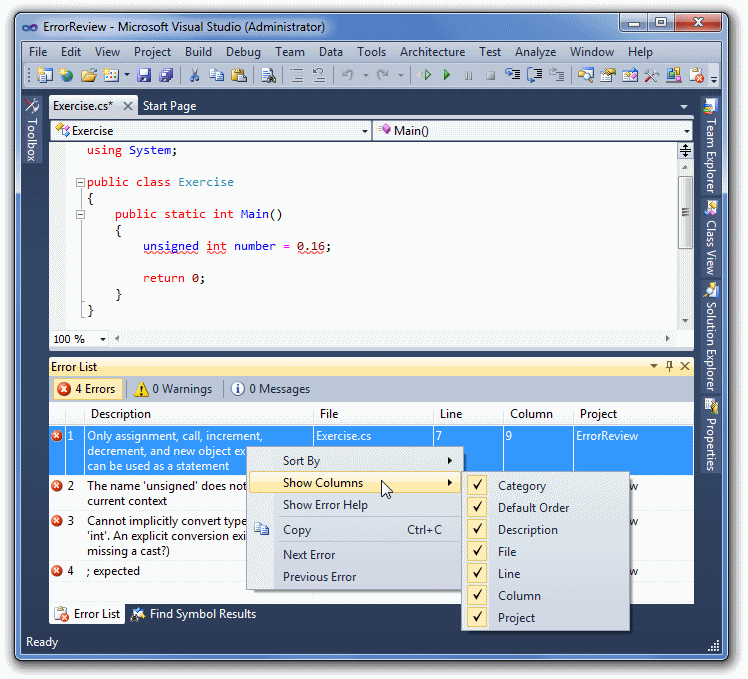
List shows its analysis of that problem. The Error list uses a table made of
5 columns that are Description, File, Line, Column, and Project. You don't
have to use all those columns. To specify what columns to show or hide,
right-click anywhere in the body of the Error List and position the mouse on
Show Columns:

To show a column, put a check mark on its menu item. To
hide a column, remove its check mark. The list of errors displays in an
incremental order specified by the parser. Otherwise, you can arrange the
order based on a column of your choice. To do this, right-click any entry in
the Error List, position the mouse on Sort By, and click the column of your
choice.
As mentioned already, the Error List uses various
columns to show its findings:
- The Description column shows a string that translates some meaning
of the problem. The parser and the Error List make an effort to point
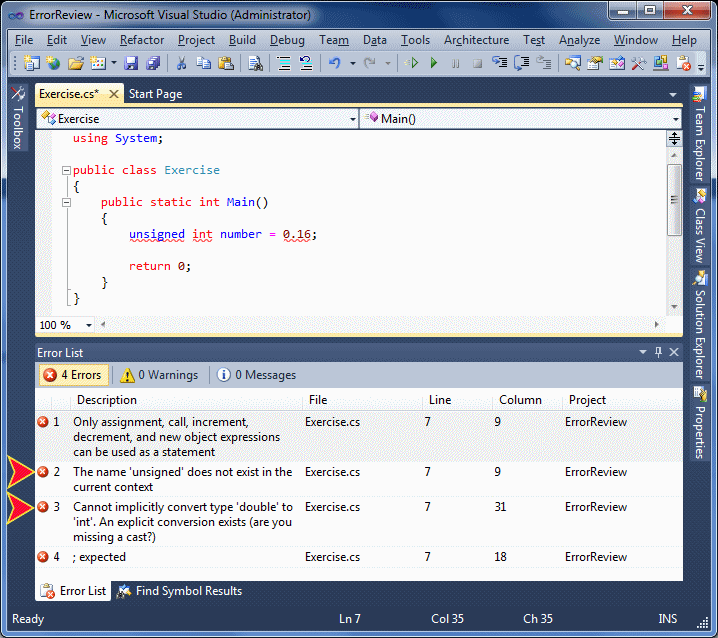
the actual problem. For example, the parser indicates here that
"unsigned" is not a valid C#Keyword. Another entry rightly points out
that an integral variable should not be initialized with a
floating-point number:

Sometimes, the error pointed out is not easy to understand. That's
the case for Description 1 in our entry. Some other time, the error may
not be completely true. For example, in the above code, the Error List
indicates a semicolon problem, which is not true: we know that all
expressions in C# must end with a semicolon. In this case, the actual
problem could be something else.
Sometimes, if you fix one problem,
all the other problems are solved. In our lessons, it is impossible to
list all types of errors or all possible types of errors. With
experience, you will know how to address and correct them
- The File column shows the name of the file. This is valuable if your
project includes many files
- The Line column is probably a junior programmer's best friend. The
Error List strives to display the line number in code where the problem
happened, or probably happened. With experience, you will know that this
is not always exact
- Like the Line number, the Column attempts to exactly point out the
character area where the problem occurrent. Also with experience, you
will find out that the Error List sometimes shows where it sensed the
problem, not necessairy when it happened
- The Project column gives the name of the project in which the error
occurred. This can be valuable if you are working on many projects, or
rather on a solution that includes many projects
To jump to an error from the Error List, locate its
entry in the Error List window and double-click it. The caret would be
positioned to that Line number, that character Column or word, and in that
File of that Project. If you correct the problem and if the parser concludes
that your correction is fine, the error would be removed automatically from
the Error List. You can continue this to correct all problems and,
eventually, the Error List would be emptied.
|
Objects Assisting With Debugging
|
|
The Immediate window is a special text editor that can
be used to test values, operations (calculations), variables, and methods.
There are two ways you can get the Immediate window:
- If you start debugging code from clicking Debug -> Start Debugging
(or pressing F5) or Debug -> Step Into (or pressing F8) from the main
menu, the Immediate window would come up
- If you are not debugging, on the main menu, you can click Debug ->
Windows -> Immediate
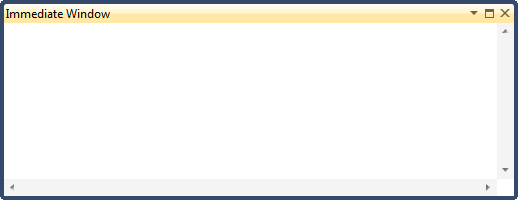
The Immediate window appears as a blank object:

To use it, you must write something. What you write
depends on what you want to test. An expression you write should start with
a question mark but in some cases you can omit that symbol. Because the
Immediate window is a text editor, you can copy code from somewhere else and
paste it in it. If the immediate window starts being crowded, to empty it,
you can right-click inside the window and click Clear All.
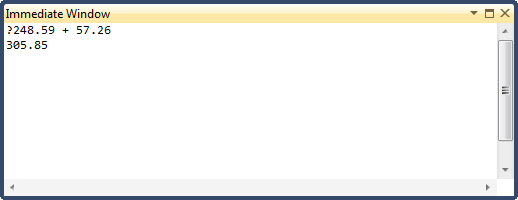
After typing or pasting the expression, press Enter. The
next line would show the result. For example, imagine you want to test an
arithmetic operation such as the addition of 248.49 and 57.26, you would
type ?248.49 + 57.26 (the empty spaces are optional and you can include as
many as you want) and press Enter. Here is an example:

If you want to test a variable or a method, you must
first write code that has the variable. That is, before testing a variable,
create a method or use the Main() function and declare the
variable in it. If you try testing a variable that is not declared, you
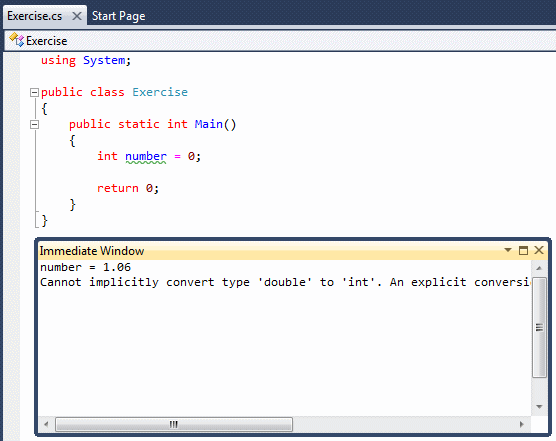
would receive an error. One way you can test a variable consists of
assigning a certain value, probably a wrong value, to it and observe the
result. You can start the assignment expression with a question mark but
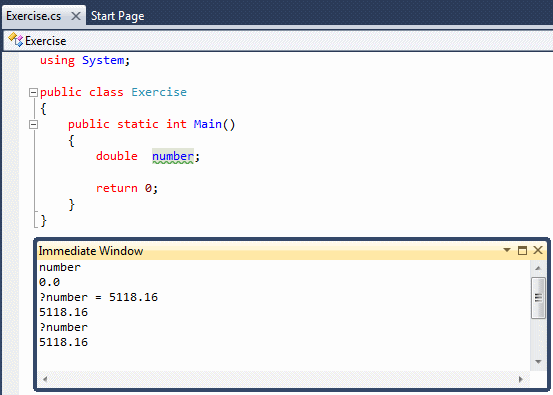
that mark is not necessary. Here is an example:

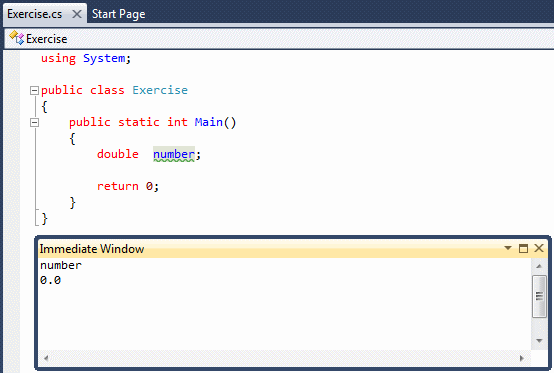
The Immediate window allows you to test the value that a
variable is currently holding. To get this information, in the Immediate
window, type the name of the variable preceded by a question mark and press
Enter:

If the variable had previously received a value, when
you enquire of it in the Immediate window, its current value would show:

Another test you can perform on a variable consists of
adding a value to it to increase it or subtracting a value from it.
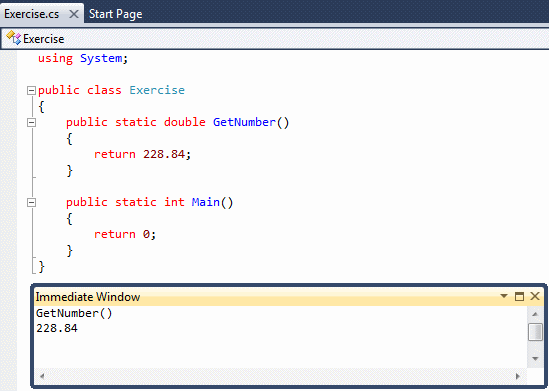
To test a method in the Immediate window, the method
should return a value. To get the value that a mehod is currently returning,
type its name in the Immediate window and press Enter. Here is an example:

In the same way, you can create more elaborate methods
and test them in the Immediate window.
|
 Application:
Using the Immediate Window Application:
Using the Immediate Window
|
|
- To start a new project, on the main menu, click File -> New Project
- In the middle list, click Empty Project
- Change the Name to PayrollEvaluation1
- Click OK
- To create a file, in the Solution Explorer, right-click
PayrollEvaluation1 -> Add -> New Item...
- In the middle list, click Code File
- Change the Name to Evaluation and click Add
- In the empty document, type the following:
using System;

public class Evaluation
{
    public static int Main()
    {
        double grossPay = 0D;
        double timeWorked = 0D;
        double hourlySalary = 0.00D;
	// double federalIncomeTax = 0.00D;
  	// const double FICATaxRate = 0.0765; // 7.65%
    	// double FICATaxAmount = 0.00D;
        double totalDeductions = 0.0D;
        double netPay = 0.00D;

        Console.Title = "Payroll Evaluation";
	/*
	Console.WriteLine("To test a payroll, enter the following pieces of information");
        Console.Write("Time Wored:    ");
        timeWorked = double.Parse(Console.ReadLine());
        Console.Write("Hourly Salary: ");
        hourlySalary = double.Parse(Console.ReadLine());
        Console.Write("Enter the amount of the deductions: ");
        totalDeductions = double.Parse(Console.ReadLine());
        */

        grossPay = hourlySalary * timeWorked;
        netPay = grossPay - totalDeductions;
        Console.Clear();

        Console.WriteLine("=======================");
        Console.WriteLine("Payroll Evaluation");
        Console.WriteLine("-----------------------");
        Console.WriteLine("Time Worked:   {0, 7}", timeWorked.ToString("F"));
        Console.WriteLine("Hourly Salary: {0, 7}", hourlySalary.ToString("F"));
        Console.WriteLine("Gross Pay:     {0, 7}", grossPay.ToString("F"));
        Console.WriteLine("Deductions:    {0, 7}", totalDeductions.ToString("F"));
        Console.WriteLine("Net Pay:       {0, 7}", netPay.ToString("F"));
        Console.WriteLine("=======================\n");

        Console.ReadKey();
        return 0;
    }
}
- To execute the application, on the main menu, click Debug -> Start
Debugging

- Press Enter to close the DOS window and return to your programming
environment
- To step into code, on the main menu, click Debug -> Step Into
- If the Imediate window is not displaying, on the main menu, click
Debug -> Windows -> Immediate.
Just in case, right-click inside the
Immediate window and click Clear All.
If you are using Microsoft
Visual C# 2010 Express, press F11 to step into code.
If you are using
Microsoft Visual Studio, press F8 to step into code
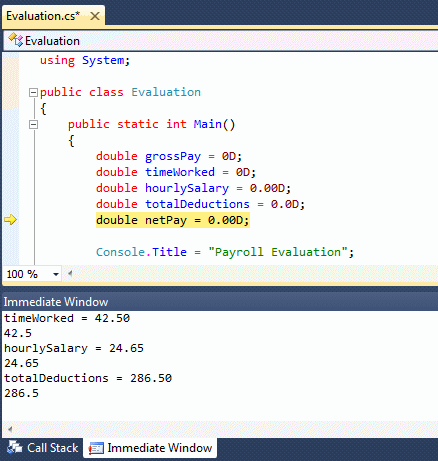
- Continue pressing the key (3 times) to step into code until you get
to the line double netPay = 0.00D;
- Click inside the Immediate window
- Type timeWorked = 42.50 and press Enter
- Type hourlySalary = 24.65 and press Enter
- Type totalDeductions = 286.50 and press Enter

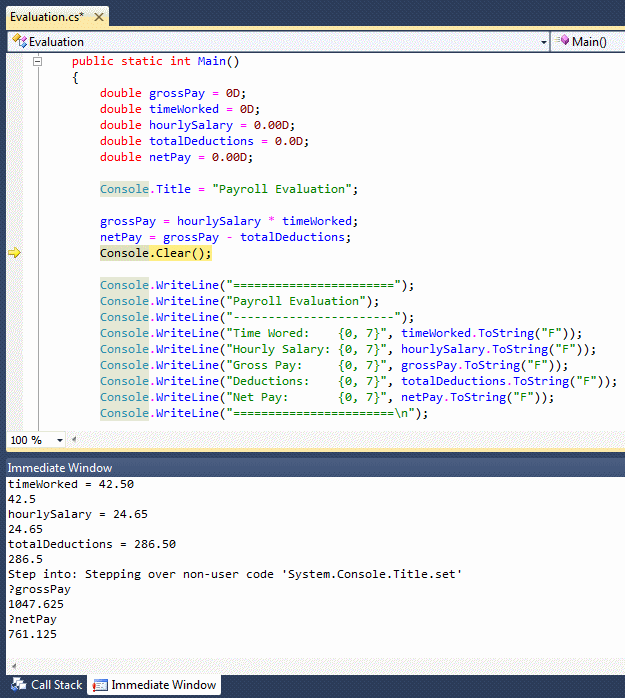
- Press F8 or F11 three or four times to step into code until you get
to the line that has Console.Clear();
- Click the next empty line in the Immediate window
- Type ?grossPay and press Enter
- Type ?netPay and press Enter

- Press the F8 or F11 key to step into code a few times until the DOS
window gets focus

- Press Enter to return to Microsoft Visual C#
- Press F8 or F11 continuously until you get to the end of code and
the DOS window closes
As debugging progresses, sometimes you may want to know
the values that the variables are holding on the current and the preceding
lines. To give you this information, Microsoft Visual Studio provides the
Autos window (Microsoft Visual C# 2010 Express doesn't have the Autos
window). Normally, when you start debugging, the Autos window comes up. If
it is hidden while you are debugging, on the main menu, click Debug ->
Windows -> Autos.
Imagine you have a variable that is accessed in various
parts of your code. One way you can test the behavior of that variable is to
test its value as it circumstancially changes time after time. The Watch
window is an object that allows you to monitor the values that a variable
(or many variables) holds (or have) in various parts of a method.
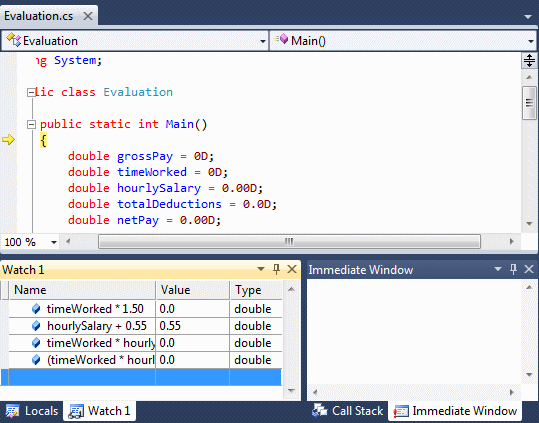
To get the Watch window, start debugging your
application (Debug -> Start Debugging or Debug -> Step Into). The Watch
window would appear, usually next to the Locals window. The Watch window
appears as a table with three columns. Their roles will be obvious to you
once the window contains something.
To actually use the services of a Watch window, you must
create one or more entries, which are referred to as watches. Before
creating a watch, you must start stepping into your code, which is done by
clicking Debug -> Step Into or by pressing F8 (Microsoft Visual Studio) or
F11 (Microsoft Visual C# 2010 Express). If the Watch window doesn't display
in Microsoft Visual C# 2010 Express, on the main menu, click Debug -> Window
-> Watch.
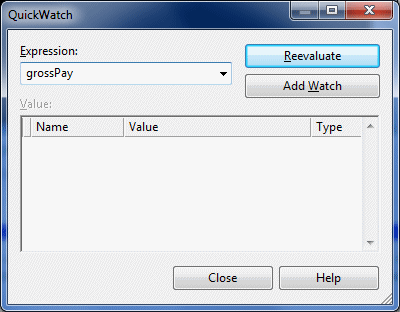
To create a watch, if you are using Microsoft Visual
Studio, on the main menu, click Debug -> QuickWatch... In the Expression
combo box, type the name of the variable you want to watch. Here is an
example:

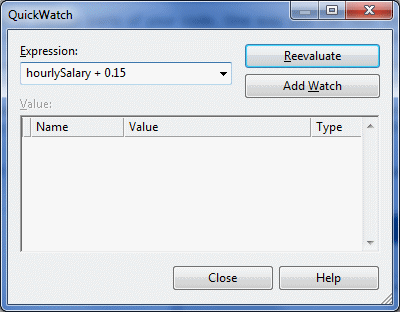
You can also type an expression such as a value added to
a variable. Here is an example:

If you want to submit the entry, click the Add Watch
button. As an alternatice, in both Microsoft Visual C# versions, in the
Watch window, double-click under the Name header, type either the name of
the variable only or an expression that has the variable and an operation,
then press Enter.
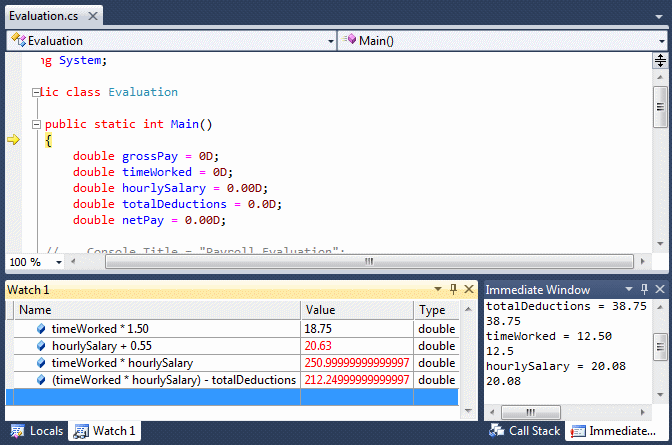
After creating the desired entries in the Watch window,
continue debugging. You will see the values being automatically updated in
the Value column of the Watch window.
If you don't need a certain entry in the Watch window,
you can remove it, or you can delete all entries in the window. To remove an
entry, right-click it and click Delete Watch. To remove all entries,
right-click anywhere in the Watch window and click Clear All.
|
 Application:
Using the Watch Window Application:
Using the Watch Window
|
|
- To start debugging, on the main menu, click Debug -> Step Into
- If the Watch window is not displaying and if you are using Microsoft
Visual C# 2010 Express, on the main menu, click Debug -> Windows ->
Watch and, just in case, right-click inside the Watch window and click
Clear All
- In the Watch window, double-click under Name, type
timeWorked * 1.50 and press Enter (this will be used to
evaluate overtime)
- Still in the Watch window, click under timeWorked * 1.50, type
hourlySalary + 0.55 and press Enter
- Click under hourlySalary + 0.55, type timeWorked *
hourlySalary and press the down arrow key
- Type (timeWorked * hourlySalary) - totalDeductions
and press Enter

- Make sure you have access to the Immediate window.
Click inside
the Immediate window
- Type timeWorked = 7.50 and press Enter
- Observe the update in the Watch window
- In the Immediate window, click the empty line, type
hourlySalary = 18.24 and press Enter
- Check the change in the Watch window
- In the Immediate window, click the empty line, type
totalDeductions = 38.75 and press Enter
- See the result in the Watch window

- Click the next empty line in the Immediate window
- Press the up arrow key to see the previously entered lines until you
get to timeWorked. Change it to timeWorked = 12.50 and
press Enter
- Press the up arrow key until hourlySalary = 18.24 is selected. Edit
it to show hourlySalary = 20.08 and press Enter

- Press F8 or F11 continuously until you get to the end of code and
the DOS window closes
While debugging, you are usually curious to know what
line, section, or file is currently being examined:
- To know the method inside of which the current
execution is proceeding, you can look into the Code Editor
- To know the line whose code is
executing, in the Code Editor, you can see a yellow right-pointing arrow
on its margin
- Since the lines of code are numbered, to know the number of the line
of code that is currently executing, you can look in the right section
of the status bar with a label marked with Ln
- If the project is using more than one file, to know the file whose
code is currently executing, you can check the label that has focus in
the top bar of the Code Editor
If you are using Microsoft Visual Studio 2010 Ultimate,
to get all of this information in one group, you can use a window named
IntelliTrace. To get the IntelliTrace window (in Microsoft Visual Studio
2010 Ultimate)
- On the main menu, click Debug -> Windows
-> IntelliTrace Events
- On the main menu, click Debug ->
Intellitrace -> IntelliTrace Events
- Press Ctrl + Alt + Y, F
|
|

