|
This exercise applies the concepts reviewed for drawing shapes. In this
case, we will draw some rectangles to product a (vertical) column chart.
|
 Practical
Learning: Drawing a Series of Rectangles Practical
Learning: Drawing a Series of Rectangles
|
|
- Start a new Windows Forms Application named YearlySales1
- Set the form's Icon to Drive:\Program Files\Microsoft Visual Studio .NET
2003\Common7\Graphics\icons\Office\GRAPH08.ICO
- Design the form as follows:
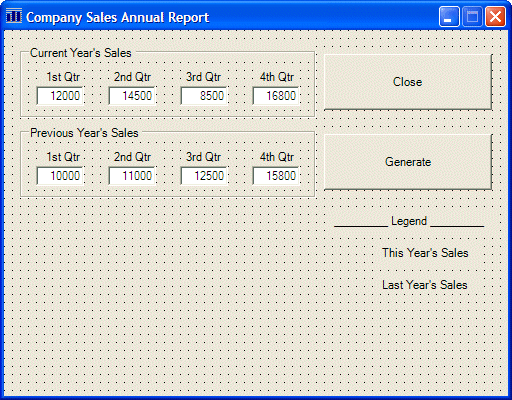 |
| Control |
Name |
Text |
Other Properties |
| GroupBox |
 |
|
Current Year's Sales |
|
| Label |
 |
|
1st Qtr |
|
| Label |
|
|
2nd Qtr |
|
| Label |
|
|
3rd Qtr |
|
| Label |
|
|
4th Qtr |
|
| TextBox |
 |
txtCurrentQtr1 |
1200 |
|
| TextBox |
|
txtCurrentQtr2 |
14500 |
TextAlign: Right |
| TextBox |
|
txtCurrentQtr3 |
8500 |
TextAlign: Right |
| TextBox |
|
txtCurrentQtr4 |
16800 |
TextAlign: Right |
| Button |
 |
Close |
btnClose |
|
| GroupBox |
|
|
Previous Year's Sales |
|
| Label |
|
|
1st Qtr |
|
| Label |
|
|
2nd Qtr |
|
| Label |
|
|
3rd Qtr |
|
| Label |
|
|
4th Qtr |
|
| TextBox |
|
txtPreviousQtr1 |
10000 |
|
| TextBox |
|
txtPreviousQtr2 |
11000 |
TextAlign: Right |
| TextBox |
|
txtPreviousQtr3 |
12500 |
TextAlign: Right |
| TextBox |
|
txtPreviousQtr4 |
15800 |
TextAlign: Right |
| Button |
|
Generate |
btnGenerate |
|
| Label |
|
|
_________ Legend _________ |
|
| Label |
|
|
This Year's Sales |
|
| Label |
|
|
Last Year's Sales |
|
|
- Double-click an unoccupied area on the form and implement its Load event
as follows:
using System;
using System.Drawing;
using System.Collections;
using System.ComponentModel;
using System.Windows.Forms;
using System.Data;

namespace YearlySales1
{
	/// <summary>
	/// Summary description for Form1.
	/// </summary>
	public class Form1 : System.Windows.Forms.Form
	{
		/// <summary>
		/// Required designer variable.
		/// </summary>
		private System.ComponentModel.Container components = null;
		Graphics graphDrawingArea;
		Bitmap   bmpDrawingArea;


		. . . No Change
		#endregion

		/// <summary>
		/// The main entry point for the application.
		/// </summary>
		[STAThread]
		static void Main()
		{
			Application.Run(new Form1());
		}

		private void Form1_Load(object sender, System.EventArgs e)
		{
			bmpDrawingArea   = new Bitmap(Width, Height);
			graphDrawingArea = Graphics.FromImage(bmpDrawingArea);
		}
	}
}
|
- Return to the form and click an empty area on it. In the Properties
window, click the Events button

- Double-click the Paint field and implement its event as follows:
private void Form1_Paint(object sender, System.Windows.Forms.PaintEventArgs e)
		{
			e.Graphics.DrawImage(bmpDrawingArea, 0, 0);
		}
|
- Double-click the Generate button and implement its Click event as follows:
private void btnGenerate_Click(object sender, System.EventArgs e)
{
	 // Retrieve the values of the current year's sales
	 int curQtr1 = int.Parse(this.txtCurrentQtr1.Text) / 100;
	 int curQtr2 = int.Parse(this.txtCurrentQtr2.Text) / 100;
	 int curQtr3 = int.Parse(this.txtCurrentQtr3.Text) / 100;
	 int curQtr4 = int.Parse(this.txtCurrentQtr4.Text) / 100;

	 // Create an array of Rectangle objects for the current year
	 Rectangle[] rectCurrentYear = { new Rectangle(this.txtCurrentQtr1.Left+20, 350-curQtr1, 40, curQtr1),
			             new Rectangle(this.txtCurrentQtr2.Left+20, 350-curQtr2, 40, curQtr2),
			             new Rectangle(this.txtCurrentQtr3.Left+20, 350-curQtr3, 40, curQtr3),
			             new Rectangle(this.txtCurrentQtr4.Left+20, 350-curQtr4, 40, curQtr4) };

	 // Retrieve the values of last year's sales
	 int prvQtr1 = int.Parse(this.txtPreviousQtr1.Text) / 100;
	 int prvQtr2 = int.Parse(this.txtPreviousQtr2.Text) / 100;
	 int prvQtr3 = int.Parse(this.txtPreviousQtr3.Text) / 100;
	 int prvQtr4 = int.Parse(this.txtPreviousQtr4.Text) / 100;

	 // Create an array of Rectangle objects for the previous year
	 Rectangle[] rectPreviousYear = { new Rectangle(this.txtPreviousQtr1.Left+30, 350-prvQtr1, 40, prvQtr1),
 			                  new Rectangle(this.txtPreviousQtr2.Left+30, 350-prvQtr2, 40, prvQtr2),
	             			      new Rectangle(this.txtPreviousQtr3.Left+30, 350-prvQtr3, 40, prvQtr3),
			                  new Rectangle(this.txtPreviousQtr4.Left+30, 350-prvQtr4, 40, prvQtr4) };

	 // In case the user has changed the values, erase the previous chart
	 graphDrawingArea.Clear(this.BackColor);

	 // Draw the chart for the previous year first to send it back
	 graphDrawingArea.DrawRectangles(new Pen(Color.Blue), rectPreviousYear);
	 // Draw the chart for the current year in front
	 graphDrawingArea.DrawRectangles(new Pen(Color.Red), rectCurrentYear);

	 // Draw the small rectangles of the legend
graphDrawingArea.DrawRectangle(new Pen(Color.Blue), this.lblCurYear.Left-30, this.lblCurYear.Top,  14, 10);
graphDrawingArea.DrawRectangle(new Pen(Color.Red), this.lblLastYear.Left-30, this.lblLastYear.Top, 14, 10);

	 graphDrawingArea.DrawRectangle(new Pen(Color.Black), 25, 350, Width - 220, 1);
	 Invalidate();
}
|
- Return to the form. Double-click the Close button and implement its Click
event as follows:
private void btnClose_Click(object sender, System.EventArgs e)
		{
			 Close();
		}
|
- Execute the application and test the form
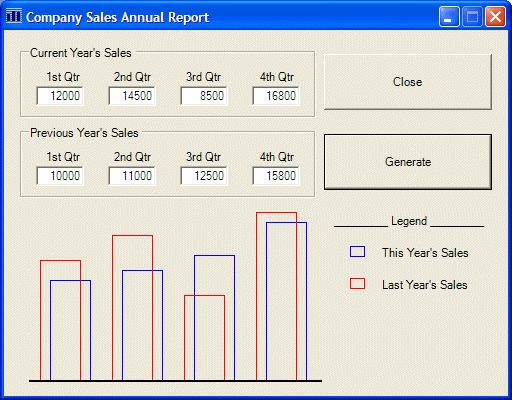
- After using it, close the form
- To fill the rectangles with colors, change the implementation of the Click event
of the Generate button as follows:
private void btnGenerate_Click(object sender, System.EventArgs e)
{
	 // Retrieve the values of the current year's sales
	 int curQtr1 = int.Parse(this.txtCurrentQtr1.Text) / 100;
	 int curQtr2 = int.Parse(this.txtCurrentQtr2.Text) / 100;
	 int curQtr3 = int.Parse(this.txtCurrentQtr3.Text) / 100;
	 int curQtr4 = int.Parse(this.txtCurrentQtr4.Text) / 100;

			 // Create an array of Rectangle objects for the current year
	 Rectangle[] rectCurrentYear = { new Rectangle(this.txtCurrentQtr1.Left+20, 350-curQtr1, 40, curQtr1),
		                             new Rectangle(this.txtCurrentQtr2.Left+20, 350-curQtr2, 40, curQtr2),
				 new Rectangle(this.txtCurrentQtr3.Left+20, 350-curQtr3, 40, curQtr3),
				 new Rectangle(this.txtCurrentQtr4.Left+20, 350-curQtr4, 40, curQtr4) };

	 // Retrieve the values of last year's sales
	 int prvQtr1 = int.Parse(this.txtPreviousQtr1.Text) / 100;
	 int prvQtr2 = int.Parse(this.txtPreviousQtr2.Text) / 100;
	 int prvQtr3 = int.Parse(this.txtPreviousQtr3.Text) / 100;
	 int prvQtr4 = int.Parse(this.txtPreviousQtr4.Text) / 100;

	 // Create an array of Rectangle objects for the previous year
	 Rectangle[] rectPreviousYear = { new Rectangle(this.txtPreviousQtr1.Left+30, 350-prvQtr1, 40, prvQtr1),
 			                  new Rectangle(this.txtPreviousQtr2.Left+30, 350-prvQtr2, 40, prvQtr2),
	             			      new Rectangle(this.txtPreviousQtr3.Left+30, 350-prvQtr3, 40, prvQtr3),
			                  new Rectangle(this.txtPreviousQtr4.Left+30, 350-prvQtr4, 40, prvQtr4) };

	 // In case the user has changed the values, erase the previous chart
	 graphDrawingArea.Clear(this.BackColor);

	 HatchBrush brushDiagCross  = new HatchBrush(HatchStyle.DiagonalCross, Color.White, Color.Blue);
	 HatchBrush brushDotDiamond = new HatchBrush(HatchStyle.DottedDiamond, Color.Fuchsia, Color.Brown);

	 // Draw the chart for the previous year first to send it back
	 graphDrawingArea.FillRectangles(brushDiagCross, rectPreviousYear);
	 graphDrawingArea.DrawRectangles(new Pen(Color.Blue), rectPreviousYear);
	 // Draw the chart for the current year in front
	 graphDrawingArea.FillRectangles(brushDotDiamond, rectCurrentYear);
	 graphDrawingArea.DrawRectangles(new Pen(Color.Red), rectCurrentYear);

	 // Draw the small rectangles of the legend
	 graphDrawingArea.FillRectangle(brushDotDiamond, this.lblCurYear.Left-30, this.lblCurYear.Top,  20, 14);
	 graphDrawingArea.DrawRectangle(new Pen(Color.Red), this.lblCurYear.Left-30, this.lblCurYear.Top,  20, 14);
	 graphDrawingArea.FillRectangle(brushDiagCross, this.lblLastYear.Left-30, this.lblLastYear.Top, 20, 14);
	 graphDrawingArea.DrawRectangle(new Pen(Color.Blue), this.lblLastYear.Left-30, this.lblLastYear.Top, 20, 14);

	 graphDrawingArea.DrawRectangle(new Pen(Color.Black), 25, 350, Width - 220, 1);
	 Invalidate();
}
|
- Return to the form. Double-click the Close button and implement its Click
event as follows:
private void btnClose_Click(object sender, System.EventArgs e)
{
	 Close();
}
|
- Execute the application and test the form
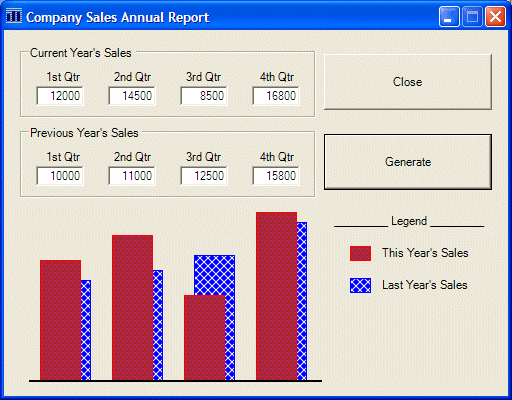
- After using it, close the form
- To draw a background behind the chart, change the Click event of the
Generate button as
follows:
private void btnGenerate_Click(object sender, System.EventArgs e)
{
	 // Retrieve the values of the current year's sales
	 int curQtr1 = int.Parse(this.txtCurrentQtr1.Text) / 100;
	 int curQtr2 = int.Parse(this.txtCurrentQtr2.Text) / 100;
	 int curQtr3 = int.Parse(this.txtCurrentQtr3.Text) / 100;
	 int curQtr4 = int.Parse(this.txtCurrentQtr4.Text) / 100;

			 // Create an array of Rectangle objects for the current year
	 Rectangle[] rectCurrentYear = { new Rectangle(this.txtCurrentQtr1.Left+20, 350-curQtr1, 40, curQtr1),
		                             new Rectangle(this.txtCurrentQtr2.Left+20, 350-curQtr2, 40, curQtr2),
				 new Rectangle(this.txtCurrentQtr3.Left+20, 350-curQtr3, 40, curQtr3),
				 new Rectangle(this.txtCurrentQtr4.Left+20, 350-curQtr4, 40, curQtr4) };

	 // Retrieve the values of last year's sales
	 int prvQtr1 = int.Parse(this.txtPreviousQtr1.Text) / 100;
	 int prvQtr2 = int.Parse(this.txtPreviousQtr2.Text) / 100;
	 int prvQtr3 = int.Parse(this.txtPreviousQtr3.Text) / 100;
	 int prvQtr4 = int.Parse(this.txtPreviousQtr4.Text) / 100;

	 // Create an array of Rectangle objects for the previous year
	 Rectangle[] rectPreviousYear = { new Rectangle(this.txtPreviousQtr1.Left+30, 350-prvQtr1, 40, prvQtr1),
 			                  new Rectangle(this.txtPreviousQtr2.Left+30, 350-prvQtr2, 40, prvQtr2),
	             			      new Rectangle(this.txtPreviousQtr3.Left+30, 350-prvQtr3, 40, prvQtr3),
			                  new Rectangle(this.txtPreviousQtr4.Left+30, 350-prvQtr4, 40, prvQtr4) };

	 // In case the user has changed the values, erase the previous chart
	 graphDrawingArea.Clear(this.BackColor);

	 Rectangle rect = new Rectangle(20, 175, 300, 175);
	 LinearGradientBrush linGradBrush = new LinearGradientBrush(rect,
				 Color.FromArgb(204, 102, 0),
				 Color.AntiqueWhite,
				 LinearGradientMode.Vertical);
	 graphDrawingArea.FillRectangle(linGradBrush, rect);
	 graphDrawingArea.DrawRectangle(new Pen(Color.Black), rect);

	 HatchBrush brushDiagCross  = new HatchBrush(HatchStyle.DiagonalCross, Color.White, Color.Blue);
	 HatchBrush brushDotDiamond = new HatchBrush(HatchStyle.DottedDiamond, Color.Fuchsia, Color.Brown);

	 // Draw the chart for the previous year first to send it back
	 graphDrawingArea.FillRectangles(brushDiagCross, rectPreviousYear);
	 graphDrawingArea.DrawRectangles(new Pen(Color.Blue), rectPreviousYear);
	 // Draw the chart for the current year in front
	 graphDrawingArea.FillRectangles(brushDotDiamond, rectCurrentYear);
	 graphDrawingArea.DrawRectangles(new Pen(Color.Red), rectCurrentYear);

	 // Draw the small rectangles of the legend
	 graphDrawingArea.FillRectangle(brushDotDiamond, this.lblCurYear.Left-30, this.lblCurYear.Top,  20, 14);
	 graphDrawingArea.DrawRectangle(new Pen(Color.Red), this.lblCurYear.Left-30, this.lblCurYear.Top,  20, 14);
	 graphDrawingArea.FillRectangle(brushDiagCross, this.lblLastYear.Left-30, this.lblLastYear.Top, 20, 14);
	 graphDrawingArea.DrawRectangle(new Pen(Color.Blue), this.lblLastYear.Left-30, this.lblLastYear.Top, 20, 14);

	 graphDrawingArea.DrawRectangle(new Pen(Color.Black), 25, 350, Width - 220, 1);
	 Invalidate();
}
|
- Execute the application to test it:

- After using the form, close it
|
|