GDI+: Line-Based Shapes
 |
GDI+: Line-Based Shapes |
private void Form1_DoubleClick(object sender, System.EventArgs e)
		{
			Graphics graph = this.CreateGraphics();
			Pen penCurrent = new Pen(Color.Red);

			graph.DrawRectangle(penCurrent, 20, 20, 248, 162);
		}
A square is a rectangle whose four sides are equal.
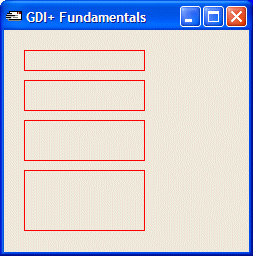
The DrawRectangle() method is used to draw one rectangle. If you plan to draw many rectangles, you can proceed in one step by using the Graphics.DrawRectangles() method. It comes in two versions whose syntaxes are: public void DrawRectangles(Pen pen, RectangleF[] rects); public void DrawRectangles(Pen pen, Rectangle[] rects); This method requires an array of Rectangle or RectangleF values. When executed, it draws individual rectangles using each member of the array as its own rectangle. Here is an example: private void Form1_DoubleClick(object sender, System.EventArgs e)
{
Graphics graph = this.CreateGraphics();
Pen penCurrent = new Pen(Color.Red);
Rectangle[] Rect = { new Rectangle(20, 20, 120, 20),
new Rectangle(20, 50, 120, 30),
new Rectangle(20, 90, 120, 40),
new Rectangle(20, 140, 120, 60) };
graph.DrawRectangles(penCurrent, Rect);
}
This would produce:  |
|
|
Lines |
|
A Line |
|
As mentioned in the previous lesson, in order to display something in a graphical application, you must draw that thing. The result of your drawing can be called a shape if it displays a recognizable figure. Sometimes it will simply be referred to as a graphic. The fundamental and easier shapes you can draw are geometric and they are the lines, rectangles, ellipse, etc. Of course, there are more complicated or advanced shapes than that. |
|
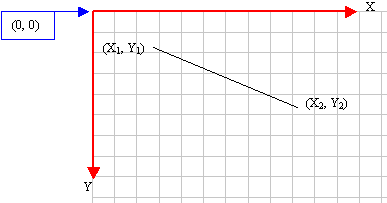
A line is a junction of two points. This means that a line has a beginning and an end:  The beginning and the end are two distinct points. Based on this, a line is represented either with two Point values or by four number representing its values on the Cartesian axes. To draw a line, the Graphics class is equipped with the following overloaded DrawLine() method: public void DrawLine(Pen pen, Point pt1, Point pt2); public void DrawLine(Pen pen, PointF pt1, PointF pt2); public void DrawLine(Pen pen, int x1, int y1, int x2, int y2); public void DrawLine(Pen pen, float x1, float y1, float x2, float y2); If the line is represented with natural numbers, its origin can be specified as a Point pt1 and its end would be represented with a Point pt2. If the line is drawn using floating numbers, you can start it at one PointF pt1 and end it at another PointF pt2. Otherwise, you can specify the starting point with coordinates (x1, y1) and the end would be represented with coordinates (x2, y2). The same type of line can be drawn using decimal values from coordinates (x1, y1) to coordinates (x2, y2). Here is an example that draws three lines:
|
private void button1_Click(object sender, System.EventArgs e)
{
	Graphics graph = this.CreateGraphics();

	Pen penCurrent = new Pen(Color.Red);
	graph.DrawLine(penCurrent, 20, 20, 205, 20);

	penCurrent = new Pen(Color.Green);
	graph.DrawLine(penCurrent, 40, 40, 225, 40);

	penCurrent = new Pen(Color.Blue);
	graph.DrawLine(penCurrent, 30, 60, 215, 60);
}
|
 |
|
A Series of Lines |
|
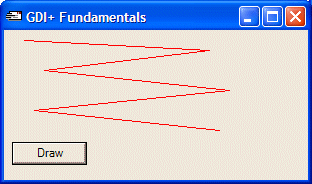
The above DrawLine() method is used to draw one line. If you intend to draw a group of lines at once, you can use the Graphics.DrawLines() method. It is overloaded with two versions as follows: public void DrawLines(Pen pen, Point[] points); public void DrawLines(Pen pen, PointF[] points); To use this method, you should first define an array of either Point for natural numbers that represent Cartesian coordinates or PointF for floating numbers. Here is an example: private void button1_Click(object sender, System.EventArgs e)
{
Graphics graph = this.CreateGraphics();
Point[] Coordinates = { new Point(20, 10), new Point(205, 20),
new Point(40, 40), new Point(225, 60),
new Point(30, 80), new Point(215, 100) };
Pen penCurrent = new Pen(Color.Red);
graph.DrawLines(penCurrent, Coordinates);
}
This would produce: 
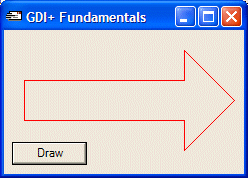
A polygon is a series of connected lines with the whole shape being closed. In other words, a polygon is defined a group of lines so that, except for the first line of the group, the starting point of each line is the same as the end point of the previous line and the end point of the last line is connected to the start point of the first line. To draw a polygon, you can use the Graphics.Polygon() method. It is overloaded with two versions as follows: public void DrawPolygon(Pen pen, Point[] points); public void DrawPolygon(Pen pen, PointF[] points); To use this method, you can first declare a Point or PointF array and pass it as the second argument to the method. Here is an example: private void button1_Click(object sender, System.EventArgs e)
{
Graphics graph = this.CreateGraphics();
Point[] Pt = { new Point(20, 50), new Point(180, 50), new Point(180, 20),
new Point(230, 70), new Point(180, 120), new Point(180, 90),
new Point(20, 90) };
Pen penCurrent = new Pen(Color.Red);
graph.DrawPolygon(penCurrent, Pt);
}
This would produce: 
|
|
|
||
| Home | Copyright © 2004-2010 FunctionX, Inc. | |
|
|
||