|
Objects Assisting With Debugging
|
|
The Immediate window is a special text editor that can
be used to test values, operations (calculations), variables, and (methods
of) classes. There are two ways you can get the Immediate window:
- If you start debugging code from clicking Debug -> Start Debugging
(or pressing F5) or Debug -> Step Into (or pressing F8) from the main
menu, the Immediate window would come up
- If you are not debugging, on the main menu, you can click Debug ->
Windows -> Immediate
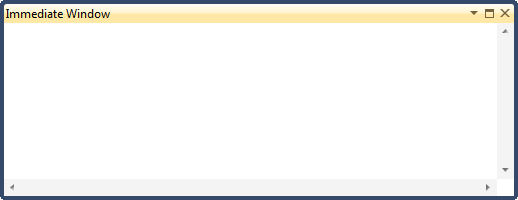
The Immediate window appears as a blank object:

To use it, you must write something. What you write
depends on what you want to test. An expression you write should start with
a question mark but in some cases you can omit that symbol. Because the
Immediate window is a text editor, you can copy code from somewhere else and
paste it in it. If the immediate window starts being crowded, to empty it,
you can right-click inside the window and click Clear All.
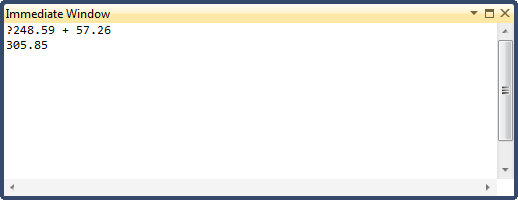
After typing or pasting the expression, press Enter. The
next line would show the result. For example, imagine you want to test an
arithmetic operation such as the addition of 248.49 and 57.26, you would
type ?248.49 + 57.26 (the empty spaces are optional and you can include as
many as you want) and press Enter. Here is an example:

If you want to test a variable or a function, you must
first write code that has the variable. That is, before testing a variable,
create a function or use the Main() function and declare
the variable in it. If you try testing a variable that is not declared, you
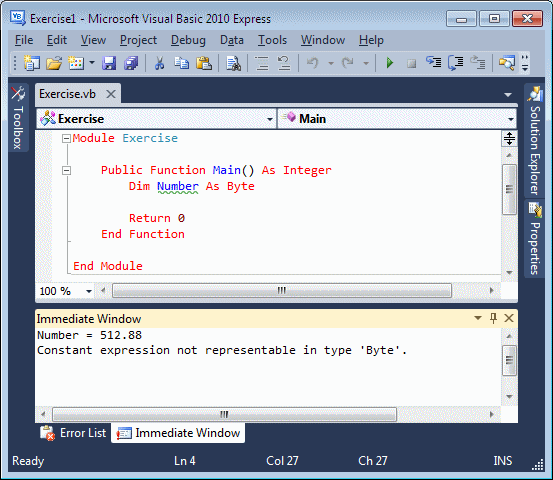
would receive an error. One way you can test a variable consists of
assigning a certain value, probably a wrong value (called a test value), to
it and observe the result. You can start the assignment expression with a
question mark but that mark is not necessary. Here is an example:

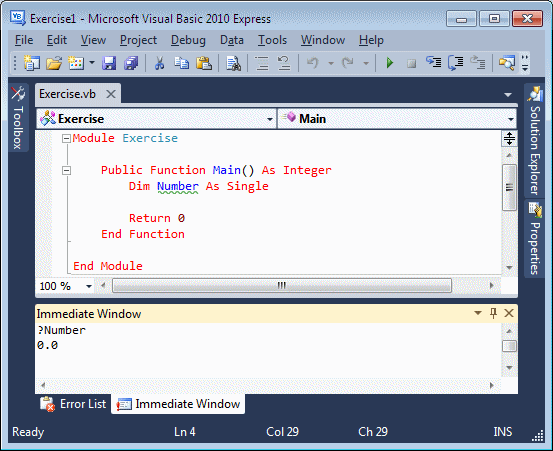
The Immediate window allows you to test the value that a
variable is currently holding. To get this information, in the Immediate
window, type the name of the variable and press Enter:

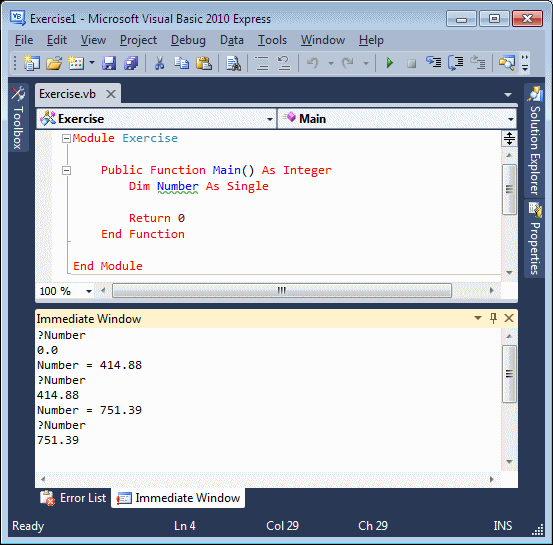
If the variable had previously received a value, when
you enquire of it in the Immediate window, its current value would show:

Another test you can perform on a variable consists of
adding a value to it to increase it or subtracting a value from it.
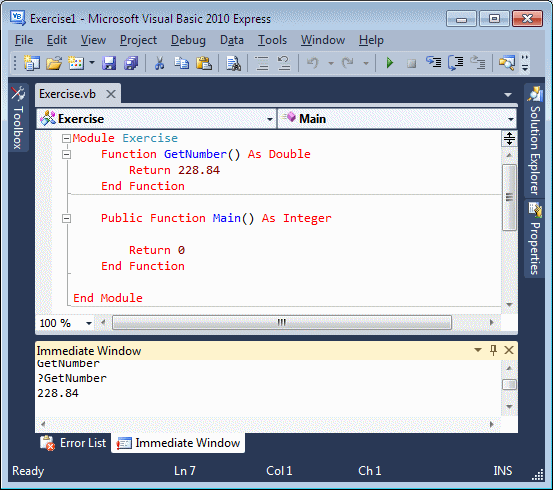
To test a procedure in the Immediate window, it must be
a function. To get the value that a function is currently returning, type
its name preceded by a question mark in the Immediate window and press
Enter. Here is an example:

In the same way, you can create more elaborate functions
and test them in the Immediate window.
|
 Application:
Using the Immediate Window Application:
Using the Immediate Window
|
|
- To start a new project, on the main menu, click File -> New Project
- In the middle list, click Console Application
- Change the Name to PayrollEvaluation1
- Click OK
- On the main menu, click Project -> PayrollEvaluation1
Properties
- Click the arrow of the Application Type box and select Windows Forms
Application
- In the Solution Explorer, right-click Module1.vb and click Rename
- Type Evaluation.vb and press Enter twice
- Change the document as follows:
Module Evaluation

    Public Function Main() As Integer
        Dim GrossPay As Double
        Dim TimeWorked As Double
        Dim HourlySalary As Double
        Dim TotalDeductions As Double
        Dim NetPay As Double
        Dim Result As String

        Result = "Payroll Evaluation" & vbCrLf

        GrossPay = HourlySalary * TimeWorked
        netPay = grossPay - totalDeductions

        Result += "===================" & vbCrLf &
                  "Payroll Evaluation" & vbCrLf &
                  "------------------------------" & vbCrLf &
                  "Time Worked:" & vbTab & TimeWorked.ToString("F") & vbCrLf &
                  "Hourly Salary:" & vbTab & HourlySalary.ToString("F") & vbCrLf &
                  "Gross Pay:" & vbTab & vbTab & GrossPay.ToString("F") & vbCrLf &
                  "Deductions:" & vbTab & TotalDeductions.ToString("F") & vbCrLf &
                  "Net Pay:" & vbTab & vbTab & NetPay.ToString("F") & vbCrLf &
                  "==================="

        MsgBox(Result,
               MsgBoxStyle.OkOnly Or MsgBoxStyle.Information,
               "Payroll Evalueation")
        Return 0
    End Function

End Module
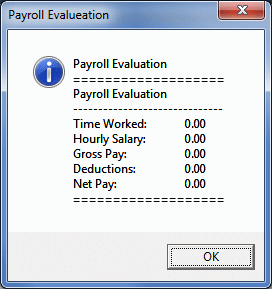
- To execute the application, on the main menu, click Debug -> Start
Debugging

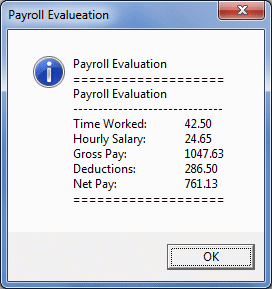
- Press Enter to close the message box and return to your programming
environment
- To step into code, on the main menu, click Debug -> Step Into
- If the Imediate window is not displaying, on the main menu, click
Debug -> Windows -> Immediate.
Just in case, right-click inside the
Immediate window and click Clear All.
Click inside the Immediate
window
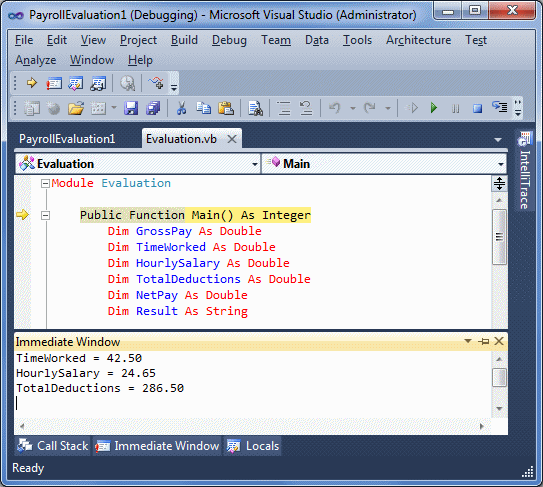
- Type TimeWorked = 42.50 and press Enter
- Type HourlySalary = 24.65 and press Enter
- Type TotalDeductions = 286.50 and press Enter

- If you are using Microsoft Visual Basic 2010 Express, press F11 to
step into code.
If you are using Microsoft Visual Studio, press F8 to
step into code
- Continue stepping into code until the debugger gets to the Result
+= "===================" & vbCrLf & line
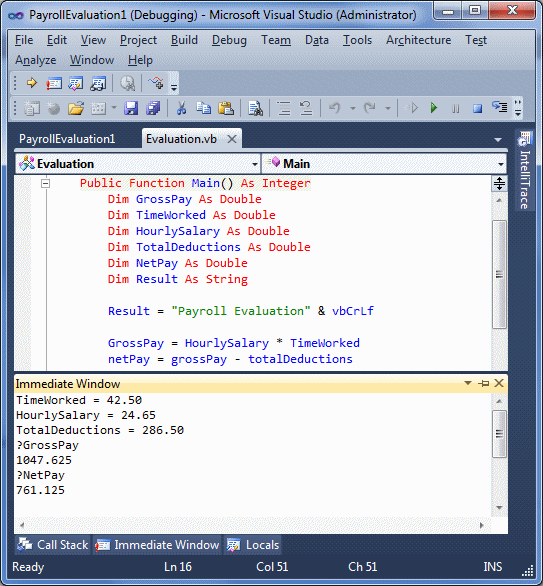
- Click the next empty line in the Immediate window
- Type ?GrossPay and press Enter
- Type ?NetPay and press Enter

- Press the F8 or F11 key to step into code a few times until the
message box displays

- Press Enter to return to Microsoft Visual Basic
As debugging progresses, sometimes you may want to know
the values that the variables are holding on the current and the preceding
lines. To give you this information, Microsoft Visual Studio provides
(Microsoft Visual Basic 2010 Express doesn't have) the Autos window.
Normally, when you start debugging, the Autos window comes up. If it is
hidden while you are debugging, on the main menu, click Debug -> Windows ->
Autos.
Imagine you have a variable that is accessed in various
parts of your code. One way you can test the behavior of that variable is to
test its value as it circumstancially changes time after time. The Watch
window is an object that allows you to monitor the values that a variable
(or many variables) holds (or have) in various parts of a method.
To get the Watch window, start debugging your
application (Debug -> Start Debugging or Debug -> Step Into). The Watch
window would appear, usually next to the Locals window. The Watch window
appears as a table with three columns. Their roles will be obvious to you
once the window contains something.
To actually use the services of a Watch window, you must
create one or more entries, which are referred to as watches. Before
creating a watch, you must start stepping into your code, which is done by
clicking Debug -> Step Into or by pressing F8 (Microsoft Visual Studio) or
F11 (Microsoft Visual Basic 2010 Express). If the Watch window doesn't
display in Microsoft Visual Basic 2010 Express, on the main menu, click
Debug -> Window -> Watch.
To create a watch, if you are using Microsoft Visual
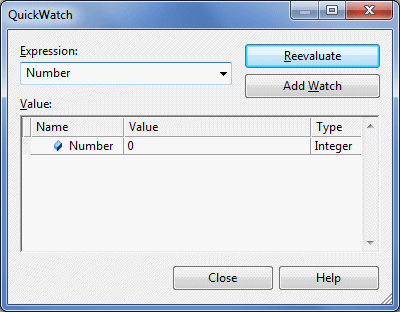
Studio, on the main menu, click Debug -> QuickWatch... In the Expression
combo box, type the name of the variable you want to watch. Here is an
example:

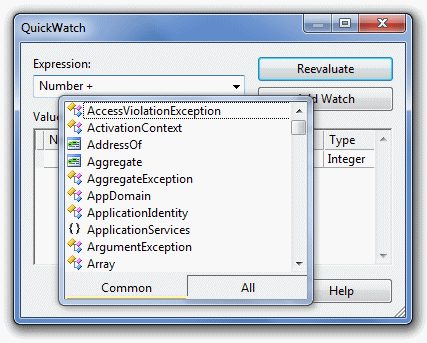
You can also type an expression such as a value added to
a variable. Here is an example:

If you want to submit the entry, click the Add Watch
button. As an alternatice, in both Microsoft Visual Basic versions, in the
Watch window, double-click under the Name header, type either the name of
the variable only or an expression that has the variable and an operation,
then press Enter.
After creating the desired entries in the Watch window,
continue debugging. You will see the values being automatically updated in
the Value column of the Watch window.
If you don't need a certain entry in the Watch window,
you can remove it, or you can delete all entries in the window. To remove an
entry, right-click it and click Delete Watch. To remove all entries,
right-click anywhere in the Watch window and click Clear All.
|
 Application:
Using the Watch Window Application:
Using the Watch Window
|
|
- To start debugging, on the main menu, click Debug -> Step Into
- If the Watch window is not displaying:
- and if you are using Microsoft Visual Basic 2010 Express, on
the main menu, click Debug -> Windows -> Watch.
- If you are using Microsoft Visual Studio, on the Debug toolbar,
click Watch 1 (if the Debug toolbar is not available, right-click
the Standard toolbar and click Debug)
Just in case, right-click
inside the Watch window and click Clear All
- In the Watch window, double-click under Name, type
TimeWorked * 1.50 and press Enter (this will be used to
evaluate overtime)
- Still in the Watch window, click under TimeWorked * 1.50, type
HourlySalary + 0.55 and press Enter
- Click under HourlySalary + 0.55, type TimeWorked *
HourlySalary and press the down arrow key
- Type (TimeWorked * HourlySalary) - TotalDeductions
and press Enter

- Make sure you have access to the Immediate window.
Click inside
the Immediate window
- Type TimeWorked = 7.50 and press Enter
- Observe the update in the Watch window
- In the Immediate window, click the empty line, type
HourlySalary = 18.24 and press Enter
- Check the change in the Watch window
- In the Immediate window, click the empty line, type
TotalDeductions = 38.75 and press Enter
- See the result in the Watch window

- Click the next empty line in the Immediate window
- Press the up arrow key to see the previously entered lines until you
get to TimeWorked. Change it to TimeWorked = 12.50 and
press Enter
- Press the up arrow key until HourlySalary = 18.24 is selected. Edit
it to show HourlySalary = 20.08 and press Enter

- Press F8 or F11 continuously to the end
While debugging, you are usually curious to know what
line, section, or file is currently being examined:
- To know the procedure inside of which the
current execution is proceeding, you can look into the Code Editor
- To know the line whose code is
executing, in the Code Editor, you can see a yellow right-pointing arrow
on its margin
- Since the lines of code are numbered, to know the number of the line
of code that is currently executing, you can look in the right section
of the status bar with a label marked with Ln
- If the project is using more than one file, to know the file whose
code is currently executing, you can check the label that has focus in
the top bar of the Code Editor
If you are using Microsoft Visual Studio 2010 Ultimate,
to get all of this information in one group, you can use a window named
IntelliTrace. To get the IntelliTrace window (in Microsoft Visual Studio
2010 Ultimate)
- On the main menu, click Debug -> Windows
-> IntelliTrace Events
- On the main menu, click Debug ->
Intellitrace -> IntelliTrace Events
- Press Ctrl + Alt + Y, F
|
 Application:
Ending the Lesson Application:
Ending the Lesson
|
|
- On the main menu, click File -> Close Solution (Microsoft Visual
Studio) or File -> Close Project (Microsoft Visual Basic 2010 Express)
- When asked whether you want to save, click Discard
|
|


