|
Types of Charts |
|
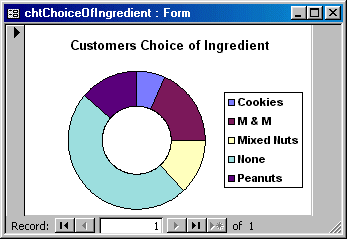
Doughnut Charts
A Doughnut chart is an alternative to the Pie chart as
both use the same types of values. The main difference between both types
of charts is that a Doughnut chart can include more than one series of
data.
 Practical Learning: Create a Column Chart
- To create a new query, on the main menu, click Insert
-> Query and, in the New Query dialog box, double-click Design View
- In the Show Table dialog box, double-click Ingredients
followed by CustomersOrders and click Close
- In the Ingredients list, double-click Ingredient
- Run the query to preview it
- Save the query as ChoiceOfIngredient then close
it
- To create a new chart, on the main menu, click Insert
-> Form
- In the New Form dialog box, click Chart Wizard
and, in the bottom combo box, select ChoiceOfIngredient and click OK
- In the first page of the Chart Wizard, click the select
one button
 to add the Ingredient item to the Fields For Chart list and click Next
 - In the second page of the Chart Wizard, click the chart
in the last column - last row Doughnut Chart
- Click Next twice
- Set the Title to Customers Choice of Ingredient and
click Finish
- Save the form as chtChoiceOfIngredient
- Print the chtChoiceOfIngredient form
- After viewing the chart, close the form
|