Lessons Logo

Types of Charts

Pie Charts

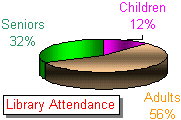
A Pie chart is used to show percentage and/or fraction values. You should choose it whenever your analysis involves values that altogether evaluate to a 100%, a 1, a 10, a 100, or a 1000 scale.

To prepare data for a Pie chart, you can select values as you would any other chart. When asked to create the chart, the chart engine would perform the necessary evaluation. It would calculate the sum of all values, then find out what proportion or fraction each category claims in the total.

Practical Learning: Creating a Pie Chart
  1. In the Database window, click Queries if necessary.
    To create a new query, double-click Create Query In Design View.
    If you are using MS Access 97, in the Queries property page of the Database window, click the New button and, in the New Query dialog box, double-click Design View
  2. In the Show Table dialog box, double-click CustomersOrders followed by Flavors and click the Close button
  3. In the Flavors list, double-click Flavor 
  4. To view the result, switch the query to Datasheet View
  5. Save the query as FlavorOrderFrequencies and close it
  6. On the main menu, click Insert -> Form
  7. In the New Form dialog box, click Chart Wizard and, in the bottom combo box, select FlavorOrderFrequencies, and click OK
  8. In the first page of the Chart Wizard, as the Flavor item is already selected in the Available Fields list, click the select one button to add Flavor to the Fields For Chart list and click Next
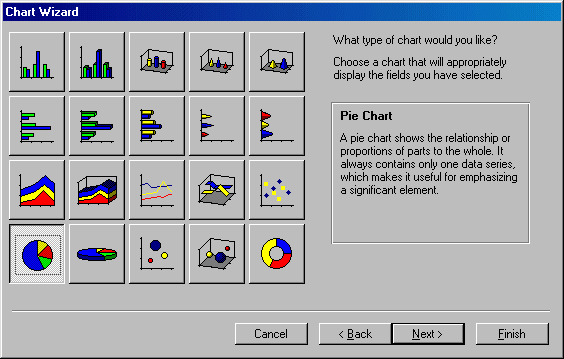
  9. In the second page of the Chart Wizard, click the chart in the 1st column - 4th row Pie Chart
     
  10. Click Next
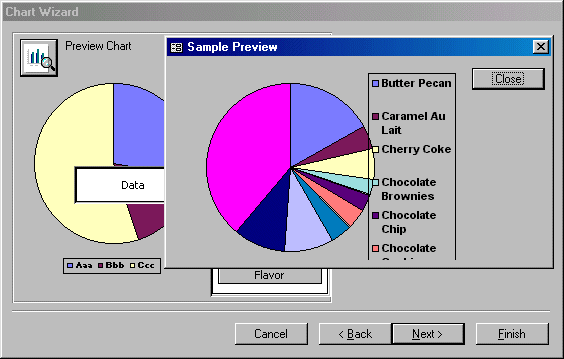
  11. To take a glimpse at the chart, click the Preview Chart button
      
  12. Click Close and click Next
  13. Set the Title to Frequency At Which A Flavor Is Ordered and press Enter
  14. After viewing the chart, save the form as chtFlavorFrequency and close it

Previous Copyright © 2002-2019, FunctionX, Inc. Next