Curves on Graphics Paths

Curves on Graphics Paths
Curves
Introduction
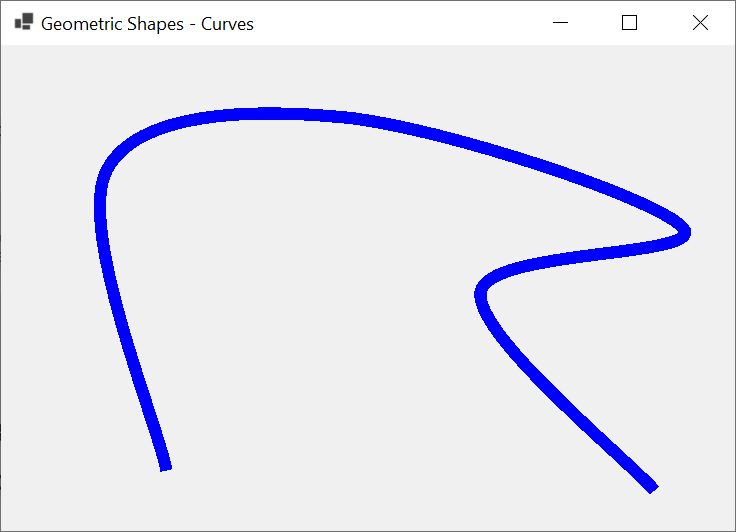
To support curves, the GraphicsPath class provides an overloaded method named AddCurve. The syntax of one of the versions is:
public void AddCurve (params System.Drawing.Point[] points);
This method expects an array of points as argument. Here is an example:
using System.Drawing.Drawing2D;

namespace GraphicsAccessories
{
    public partial class Exercise : Form
    {
        public Exercise()
        {
            InitializeComponent();
        }

        private void Exercise_Paint(object sender, PaintEventArgs e)
        {
            Graphics graph = e.Graphics;
            Pen pnBlue     = new(Color.Blue, 12.25f);

            Point[] points = { new(165,  425),
                               new(105,  125),
                               new(344,   72),
                               new(682,  183),
                               new(479,  247),
                               new(653,  445) };

            GraphicsPath gp = new GraphicsPath();

            gp.AddCurve(points);

            graph.DrawPath(pnBlue, gp);
        }
    }
}
This would produce:
If you want the curve to use more precise values, the GraphicsPath class provides the following version of the AddCurve() method:
public void AddCurve(params System.Drawing.PointF[] points);
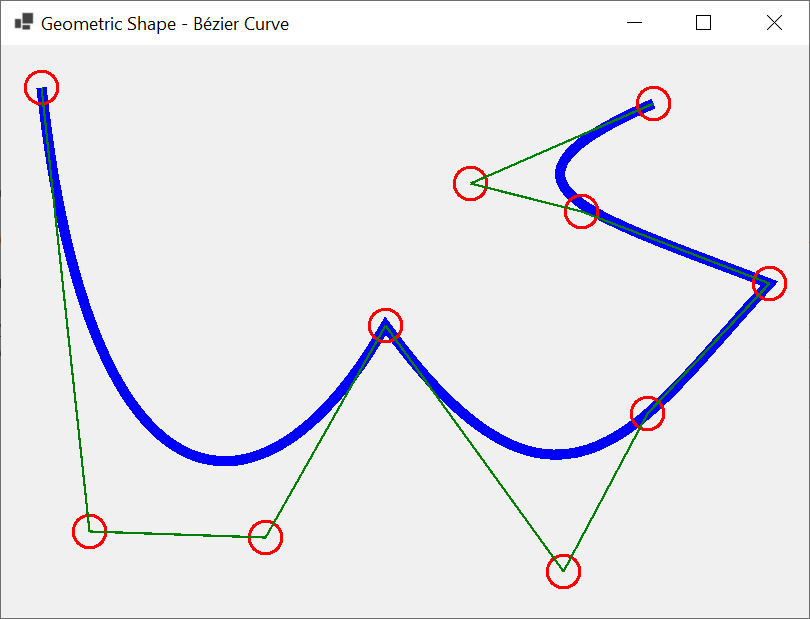
The Tension a Curve
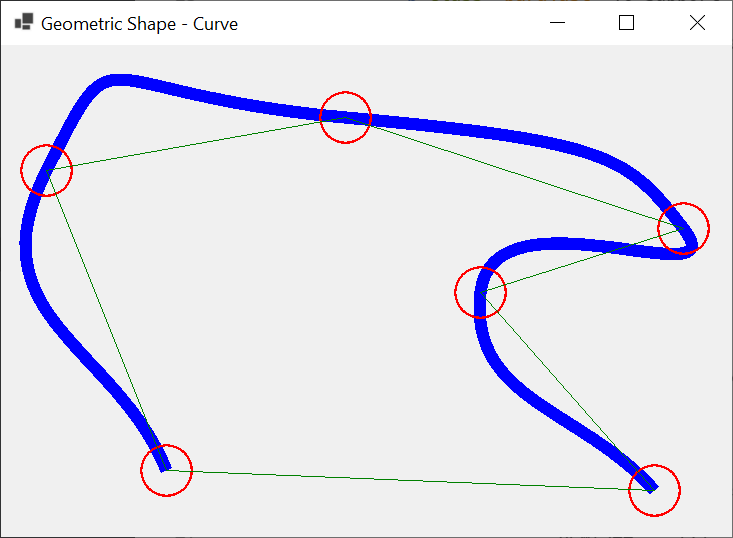
To let you specify the amount of bending the curve, the GraphicsPath class provides the following version of the AddCurve() method:
public void AddCurve(System.Drawing.PointF[] points, float tension);
The value of the tension must be a decimal value. Here is an example:
using System.Drawing.Drawing2D;

namespace GraphicsAccessories
{
    public partial class Exercise : Form
    {
        public Exercise()
        {
            InitializeComponent();
        }

        private void Exercise_Paint(object sender, PaintEventArgs e)
        {
            Graphics graph = e.Graphics;
            Pen pnBlue     = new(Color.Blue, 12.25f);
            Pen pnMarker   = new(Color.Red,   2.25f);
            Pen pnLine     = new(Color.Green, 1.25f);

            Point[] points = { new(165,  425),
                               new( 45,  125),
                               new(344,   72),
                               new(682,  183),
                               new(479,  247),
                               new(653,  445) };

            GraphicsPath gp = new GraphicsPath();

            gp.AddCurve(points, 1.25F);

            graph.DrawPath(pnBlue, gp);

            graph.DrawEllipse(pnMarker, points[0].X - 25.25F, points[0].Y - 25.25F, 50.50F, 50.50F);
            graph.DrawEllipse(pnMarker, points[1].X - 25.25F, points[1].Y - 25.25F, 50.50F, 50.50F);
            graph.DrawEllipse(pnMarker, points[2].X - 25.25F, points[2].Y - 25.25F, 50.50F, 50.50F);
            graph.DrawEllipse(pnMarker, points[3].X - 25.25F, points[3].Y - 25.25F, 50.50F, 50.50F);
            graph.DrawEllipse(pnMarker, points[4].X - 25.25F, points[4].Y - 25.25F, 50.50F, 50.50F);
            graph.DrawEllipse(pnMarker, points[5].X - 25.25F, points[5].Y - 25.25F, 50.50F, 50.50F);


            graph.DrawLine(pnLine, points[0].X, points[0].Y, points[1].X, points[1].Y);
            graph.DrawLine(pnLine, points[1].X, points[1].Y, points[2].X, points[2].Y);
            graph.DrawLine(pnLine, points[2].X, points[2].Y, points[3].X, points[3].Y);
            graph.DrawLine(pnLine, points[3].X, points[3].Y, points[4].X, points[4].Y);
            graph.DrawLine(pnLine, points[4].X, points[4].Y, points[5].X, points[5].Y);
            graph.DrawLine(pnLine, points[5].X, points[5].Y, points[0].X, points[0].Y);
        }
    }
}
This would produce:
Bézier Curves
Adding a Bézier Curve
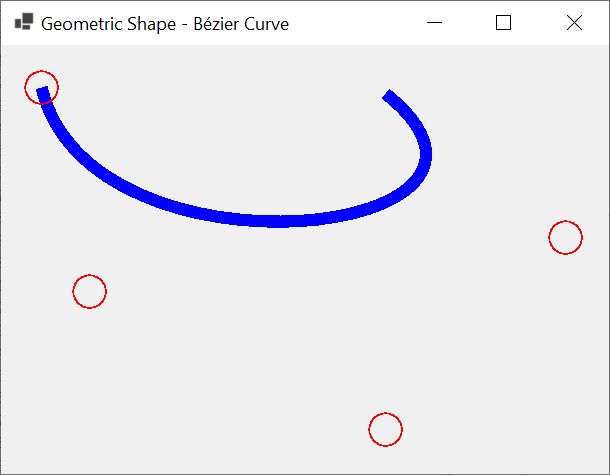
To support bézier curves, the GraphicsPath class is equipped with an overloaded method named AddBezier. One of the versions uses the following syntax:
public void AddBezier(Point pt1, Point pt2, Point pt3, Point pt4);
This method takes four Point objects as arguments. Here is an example:
using System.Drawing.Drawing2D;

namespace GraphicsAccessories
{
    public partial class Exercise : Form
    {
        public Exercise()
        {
            InitializeComponent();
        }

        private void Exercise_Paint(object sender, PaintEventArgs e)
        {
            Graphics graph = e.Graphics;
            GraphicsPath path = new GraphicsPath();

            Pen pnRed  = new(Color.Red, 1.88F);
            Pen pnBlue = new(Color.Blue, 12.25f);

            Point pt1  = new(40, 42);
            Point pt2  = new(88, 246);
            Point pt3  = new(564, 192);
            Point pt4  = new(384, 48);

            path.AddBezier(pt1, pt2, pt3, pt4);

            graph.DrawPath(pen: pnBlue, path);

            e.Graphics.DrawEllipse(pnRed, pt1.X - 16.25F, pt1.Y - 16.25F, 32.50F, 32.50F);
            e.Graphics.DrawEllipse(pnRed, pt2.X - 16.25F, pt2.Y - 16.25F, 32.50F, 32.50F);
            e.Graphics.DrawEllipse(pnRed, pt3.X - 16.25F, pt3.Y - 16.25F, 32.50F, 32.50F);
            e.Graphics.DrawEllipse(pnRed, pt4.X - 16.25F, pt4.X - 16.25F, 32.50F, 32.50F);
        }
    }
}
This would produce:
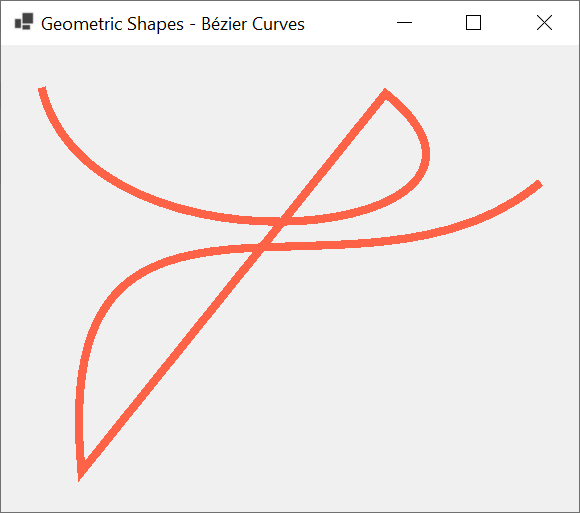
Adding many Bézier Curves
We already know, to draw many bézier curves, you call the Graphics.DrawBezier() method as many times as you want, in which case each curve is drawn independently of the other curves. The GraphicsPath class brings another way to perform that operation. You can call the GraphicsPath.AddBezier() each time you want to add a bézier curve. When you finally call the Graphics.DrawPath() method, when drawing the shape, the compiler would attach each end point of a curve to the starting point of the next curve. Consider the following example:
using System.Drawing.Drawing2D;

namespace GraphicsAccessories
{
    public partial class Exercise : Form
    {
        public Exercise()
        {
            InitializeComponent();
        }

        private void Exercise_Paint(object sender, PaintEventArgs e)
        {
            Graphics graph = e.Graphics;
            GraphicsPath path = new GraphicsPath();

            Pen pnMain = new(Color.Tomato, 8.25f);

            // Points for the first curve
            Point pt1  = new(40, 42);
            Point pt2  = new(88, 246);
            Point pt3  = new(564, 192);
            Point pt4  = new(384, 48);

            path.AddBezier(pt1, pt2, pt3, pt4);

            // Points for the second curve
            pt1 = new( 80, 426);
            pt2 = new( 46,  68);
            pt3 = new(357, 288);
            pt4 = new(539, 137);

            path.AddBezier(pt1, pt2, pt3, pt4);

            graph.DrawPath(pnMain, path);
        }
    }
}
This would produce:
Instead of defining individual points as done above, the GraphicsPath class allows you to use an array of points. To support this, the class provides an overloaded method named AddBeziers. One of its syntaxes is:
public void AddBeziers(params System.Drawing.Point[] points);
This method takes an array of points as argument. Here is an example:
using System.Drawing.Drawing2D;

namespace GraphicsAccessories
{
    public partial class Exercise : Form
    {
        public Exercise()
        {
            InitializeComponent();
        }

        private void Exercise_Paint(object sender, PaintEventArgs e)
        {
            Graphics graph = e.Graphics;
            GraphicsPath path = new GraphicsPath();

            Pen pnMain = new(Color.Tomato, 8.25f);

            Point[] pts  = { new( 40,  42),
                             new( 88, 246),
                             new(564, 192),
                             new(384,  48) };

            path.AddBeziers(pts);

            graph.DrawPath(pnMain, path);
        }
    }
}
We already know that the Graphics.DrawBeziers() method allows you to provide an array of 4, 7, or 10 points to draw a curve that contains many bézier sections. To support the same concept, the GraphicsPath class provides an overloaded method named AddBeziers. One of the versions is provided with the following syntax:
public void AddBeziers(params System.Drawing.Point[] points);
As is the case with the GraphicsPath.AddBeziers() expects an array of points as argument. The array must contain a number of point that is a multiple of 3 + 1. Here is an example that uses an array of 10 points:
using System.Drawing.Drawing2D;

namespace GraphicsAccessories
{
    public partial class Exercise : Form
    {
        public Exercise()
        {
            InitializeComponent();
        }

        private void Exercise_Paint(object sender, PaintEventArgs e)
        {
            Graphics graph = e.Graphics;
            GraphicsPath path = new GraphicsPath();

            Pen pnMain   = new(Color.Blue, 10.25f);
            Pen pnMarker = new Pen(Color.Red, 3.15F);
            Pen pnLine   = new Pen(Color.Green, 2.25F);

            Point[] pts    = { new( 40,  42),
                               new( 88, 486),
                               new(264, 492),
                               new(384, 280),
                               new(562, 526),
                               new(646, 368),
                               new(768, 238),
                               new(580, 166),
                               new(469, 138),
                               new(652,  58) };

            path.AddBeziers(pts);

            graph.DrawPath(pnMain, path);

            graph.DrawEllipse(pnMarker, pts[0].X - 16.25F, pts[0].Y - 16.25F, 32.50F, 32.50F);
            graph.DrawEllipse(pnMarker, pts[1].X - 16.25F, pts[1].Y - 16.25F, 32.50F, 32.50F);
            graph.DrawEllipse(pnMarker, pts[2].X - 16.25F, pts[2].Y - 16.25F, 32.50F, 32.50F);
            graph.DrawEllipse(pnMarker, pts[3].X - 16.25F, pts[3].Y - 16.25F, 32.50F, 32.50F);
            graph.DrawEllipse(pnMarker, pts[4].X - 16.25F, pts[4].Y - 16.25F, 32.50F, 32.50F);
            graph.DrawEllipse(pnMarker, pts[5].X - 16.25F, pts[5].Y - 16.25F, 32.50F, 32.50F);
            graph.DrawEllipse(pnMarker, pts[6].X - 16.25F, pts[6].Y - 16.25F, 32.50F, 32.50F);
            graph.DrawEllipse(pnMarker, pts[7].X - 16.25F, pts[7].Y - 16.25F, 32.50F, 32.50F);
            graph.DrawEllipse(pnMarker, pts[8].X - 16.25F, pts[8].Y - 16.25F, 32.50F, 32.50F);
            graph.DrawEllipse(pnMarker, pts[9].X - 16.25F, pts[9].Y - 16.25F, 32.50F, 32.50F);


            graph.DrawLine(pnLine, pts[0].X, pts[0].Y, pts[1].X, pts[1].Y);
            graph.DrawLine(pnLine, pts[1].X, pts[1].Y, pts[2].X, pts[2].Y);
            graph.DrawLine(pnLine, pts[2].X, pts[2].Y, pts[3].X, pts[3].Y);
            graph.DrawLine(pnLine, pts[3].X, pts[3].Y, pts[4].X, pts[4].Y);
            graph.DrawLine(pnLine, pts[4].X, pts[4].Y, pts[5].X, pts[5].Y);
            graph.DrawLine(pnLine, pts[5].X, pts[5].Y, pts[6].X, pts[6].Y);
            graph.DrawLine(pnLine, pts[6].X, pts[6].Y, pts[7].X, pts[7].Y);
            graph.DrawLine(pnLine, pts[7].X, pts[7].Y, pts[8].X, pts[8].Y);
            graph.DrawLine(pnLine, pts[8].X, pts[8].Y, pts[9].X, pts[9].Y);
        }
    }
}
This would produce:
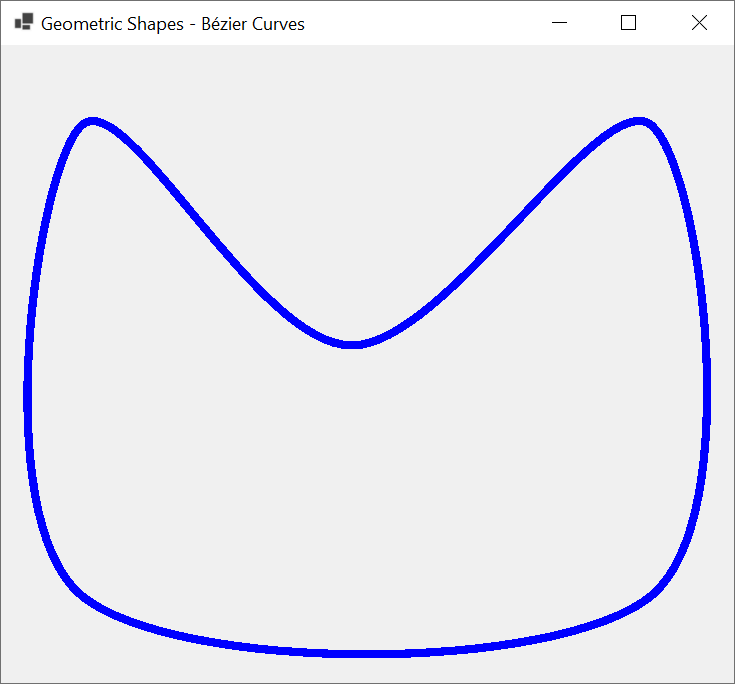
Closed Curves
Introduction
To support closed curves, the GraphicsPath class provides an overloaded method named AddClosedCurve. One of the implementations uses the following syntax:
public void AddClosedCurve(params System.Drawing.Point[] points);
This method expects an array of points as argument. Here is an example of calling that method:
using System.Drawing.Drawing2D;

namespace GraphicsAccessories
{
    public partial class Exercise : Form
    {
        public Exercise()
        {
            InitializeComponent();
        }

        private void Exercise_Paint(object sender, PaintEventArgs e)
        {
            Graphics graph = e.Graphics;
            Pen pnBlue = new(Color.Blue, 8.25f);

            Point[] points = { new( 80, 550),
                               new( 80,  80),
                               new(350, 300),
                               new(650,  80),
                               new(650, 550) };

            GraphicsPath gp = new GraphicsPath();

            gp.AddClosedCurve(points);

            graph.DrawPath(pnBlue, gp);
        }
    }
}
This would produce:
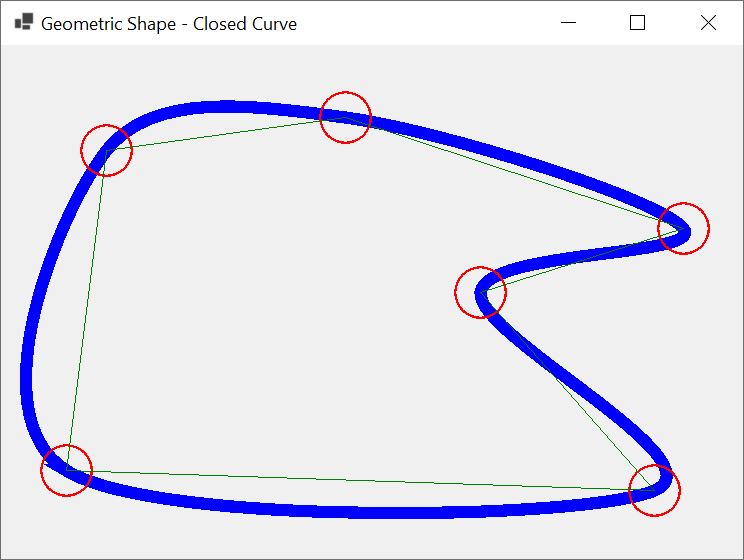
The arguments in the above version of the GraphicsPath.AddClosedCurve() method use integers for their values. An alternative is to use floating-point numbers. To support this, the GraphicsPath class provides another version of ist AddClosedCurve method. It syntax is:
public void AddClosedCurve(params System.Drawing.PointF[] points);
The points of this version use decimal values. In both cases, you can pass an array that contains a number of points of yoour choice. Consider the following example:
using System.Drawing.Drawing2D;

namespace GraphicsAccessories
{
    public partial class Exercise : Form
    {
        public Exercise()
        {
            InitializeComponent();
        }

        private void Exercise_Paint(object sender, PaintEventArgs e)
        {
            Graphics graph = e.Graphics;
            Pen pnBlue     = new(Color.Blue, 12.25f);
            Pen pnMarker   = new(Color.Red,   2.25f);
            Pen pnLine     = new(Color.Green, 1.25f);

            Point[] points = { new( 65,  425),
                               new(105,  105),
                               new(344,   72),
                               new(682,  183),
                               new(479,  247),
                               new(653,  445) };

            GraphicsPath gp = new GraphicsPath();

            gp.AddClosedCurve(points);

            graph.DrawPath(pnBlue, gp);

            graph.DrawEllipse(pnMarker, points[0].X - 25.25F, points[0].Y - 25.25F, 50.50F, 50.50F);
            graph.DrawEllipse(pnMarker, points[1].X - 25.25F, points[1].Y - 25.25F, 50.50F, 50.50F);
            graph.DrawEllipse(pnMarker, points[2].X - 25.25F, points[2].Y - 25.25F, 50.50F, 50.50F);
            graph.DrawEllipse(pnMarker, points[3].X - 25.25F, points[3].Y - 25.25F, 50.50F, 50.50F);
            graph.DrawEllipse(pnMarker, points[4].X - 25.25F, points[4].Y - 25.25F, 50.50F, 50.50F);
            graph.DrawEllipse(pnMarker, points[5].X - 25.25F, points[5].Y - 25.25F, 50.50F, 50.50F);

            graph.DrawLine(pnLine, points[0].X, points[0].Y, points[1].X, points[1].Y);
            graph.DrawLine(pnLine, points[1].X, points[1].Y, points[2].X, points[2].Y);
            graph.DrawLine(pnLine, points[2].X, points[2].Y, points[3].X, points[3].Y);
            graph.DrawLine(pnLine, points[3].X, points[3].Y, points[4].X, points[4].Y);
            graph.DrawLine(pnLine, points[4].X, points[4].Y, points[5].X, points[5].Y);
            graph.DrawLine(pnLine, points[5].X, points[5].Y, points[0].X, points[0].Y);
        }
    }
}
This would produce:
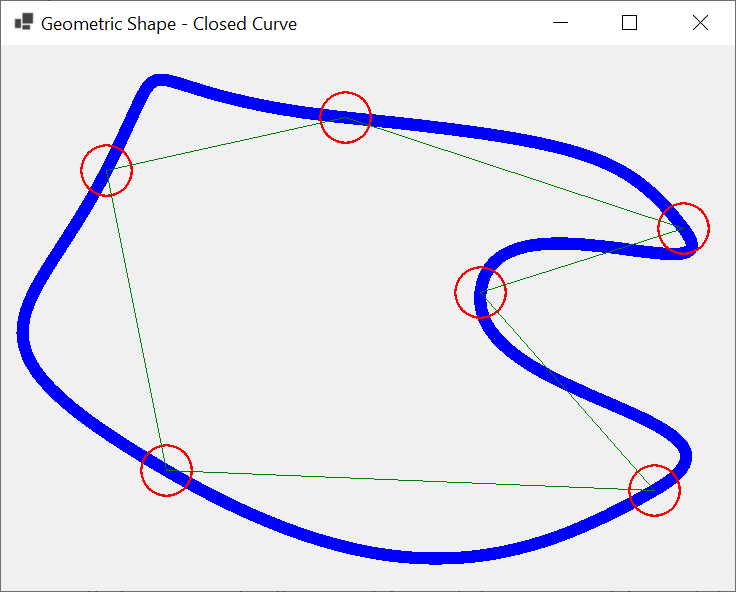
The Tension of a Closed Curve
To let you apply a tension to a closed curve, the GraphicsPath class provides another version of its AddClosedCurve() method. Its syntax is:
public void AddClosedCurve(System.Drawing.Point[] points, float tension);
The new argument, the tension, is a decimal value between 0 and 1. Here is an example:
using System.Drawing.Drawing2D;

namespace GraphicsAccessories
{
    public partial class Exercise : Form
    {
        public Exercise()
        {
            InitializeComponent();
        }

        private void Exercise_Paint(object sender, PaintEventArgs e)
        {
            Graphics graph = e.Graphics;
            Pen pnBlue     = new(Color.Blue, 12.25f);
            Pen pnMarker   = new(Color.Red,   2.25f);
            Pen pnLine     = new(Color.Green, 1.25f);

            Point[] points = { new(165,  425),
                               new(105,  125),
                               new(344,   72),
                               new(682,  183),
                               new(479,  247),
                               new(653,  445) };

            GraphicsPath gp = new GraphicsPath();

            gp.AddClosedCurve(points, 1.25F);

            graph.DrawPath(pnBlue, gp);

            graph.DrawEllipse(pnMarker, points[0].X - 25.25F, points[0].Y - 25.25F, 50.50F, 50.50F);
            graph.DrawEllipse(pnMarker, points[1].X - 25.25F, points[1].Y - 25.25F, 50.50F, 50.50F);
            graph.DrawEllipse(pnMarker, points[2].X - 25.25F, points[2].Y - 25.25F, 50.50F, 50.50F);
            graph.DrawEllipse(pnMarker, points[3].X - 25.25F, points[3].X - 25.25F, 50.50F, 50.50F);
            graph.DrawEllipse(pnMarker, points[4].X - 25.25F, points[4].Y - 25.25F, 50.50F, 50.50F);
            graph.DrawEllipse(pnMarker, points[5].X - 16.25F, points[5].Y - 16.25F, 32.50F, 32.50F);

            graph.DrawLine(pnLine, points[0].X, points[0].Y, points[1].X, points[1].Y);
            graph.DrawLine(pnLine, points[1].X, points[1].Y, points[2].X, points[2].Y);
            graph.DrawLine(pnLine, points[2].X, points[2].Y, points[3].X, points[3].Y);
            graph.DrawLine(pnLine, points[3].X, points[3].Y, points[4].X, points[4].Y);
            graph.DrawLine(pnLine, points[4].X, points[4].Y, points[5].X, points[5].Y);
            graph.DrawLine(pnLine, points[5].X, points[5].Y, points[0].X, points[0].Y);
        }
    }
}
This would produce:
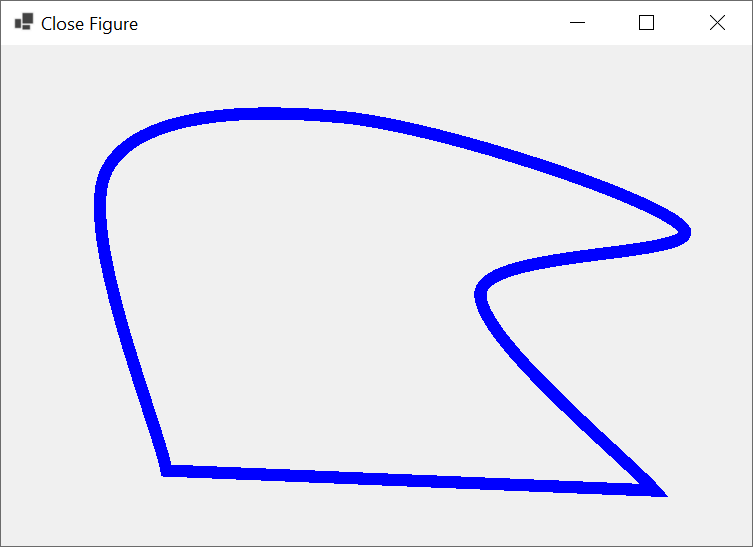
Closing a Curve
We already know that when you are drawing a curve, by default, the curve is opened. In some cases, you may want to close the curve. You have many options. You can manually close the curve by joining the last and the first points. To automatically support this operation, the GraphicsPath class is equipped with a method named CloseCurve. Its syntax is:
public void CloseFigure();
You can call this method after calling the methods that Add... some paths. When this is done, the compiler would join thee last and the first point, which can consist of drawing a line from the last to the first point. Here is an example:
using System.Drawing.Drawing2D;

namespace GraphicsAccessories
{
    public partial class Exercise : Form
    {
        public Exercise()
        {
            InitializeComponent();
        }

        private void Exercise_Paint(object sender, PaintEventArgs e)
        {
            Graphics graph = e.Graphics;
            Pen pnBlue     = new(Color.Blue, 12.25f);

            Point[] points = { new(165,  425),
                               new(105,  125),
                               new(344,   72),
                               new(682,  183),
                               new(479,  247),
                               new(653,  445) };

            GraphicsPath gp = new GraphicsPath();

            gp.AddCurve(points);
            gp.CloseFigure();

            graph.DrawPath(pnBlue, gp);
        }
    }
}
This would produce:
![]() Practical Learning: Ending the Lesson
Practical Learning: Ending the Lesson
|
|
|||
| Previous | Copyright © 2010-2024, FunctionX | Friday 24 April 2024 | Next |
|
|
|||