 |
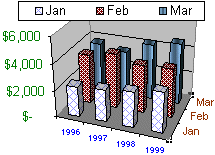
A column chart can render a very effective result when analyzing data of the same category on a defined scale. The column chart emphasizes high and low values.
It helps to compare
items.
The classic column chart is made of flat bars that simply illustrate maximal, minimal, and in-between values. One of the options allows you to create a 3-dimensional look of the chart and further accentuate the colors and/or other graphic effects. To enhance an effective analysis, you can create a real 3-D chart that shows data and graphics in perspective. |
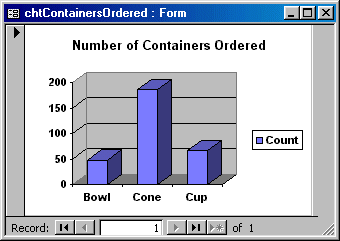
We are going to create a chart to shows us how often a
particular container gets ordered. During data analysis, this type of
chart can show management what type of container should be supplied more
often.
 Practical Learning: Creating a Column Chart
- From the resources that accompany our lessons, copy the
Clarksville Ice Cream1 database and paste it in your Exercises folder
- Start Microsoft Access and open the Clarksville Ice Cream1 database. If necessary, click Queries in the Database window
- To create a new query, double-click Create Query In
Design View.
If you are using MS Access 97, in the Queries property page of the Database
window, click the New button and, in the New Query dialog box, double-click
Design View - In the Show Table dialog box, double-click CustomersOrders
followed by Containers and click the Close button
- In the Containers list, double-click Container
- To view the result, switch the query to Datasheet View
- Save the query as ContainerOrderFrequency and
close it
- On the main menu, click Insert -> Form
- In the New Form dialog box, click Chart Wizard
and, in the bottom combo box, select ContainerOrderFrequency
- Click OK
- In the first page of the Chart Wizard, in the Available
Fields list, double-click Container to include it in the Fields For Chart
list:
- Click Next
- In the second page of the Chart Wizard, click the chart
in the 2nd column - 1st row 3-D Columnar Chart
- Click Next
- To take a glimpse at the chart, click the Preview Chart
button
- Click Close and click Next
- Set the Title to Number of Containers Ordered and
press Enter
- Save the form as chtContainersOrdered
- After viewing the chart, close the form
- Print the chtContainersOrdered form


