- Open the Clarksville Ice Cream you were working on the previous
lesson
- In the Database window, click Forms and double-click the
chtFlavorFrequency form to open it
- After viewing the chart, switch the form to Design View
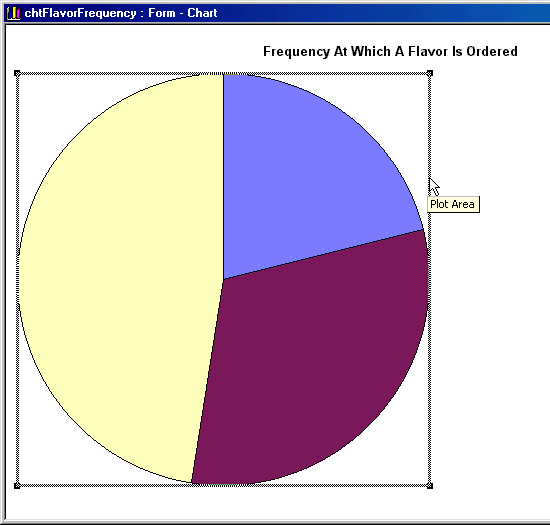
- Right-click the chart, position the mouse on Chart Object and click
Edit. This opens the Microsoft Graph window
- Using the lower-right corner of the the Microsoft Graph window,
resize it as much as you can afford
- Using the lower-right corner of the form, increase the size of the
chtFlavorFrequency window as much as possible
- After enlarging the chtFlavorFrequency window, click somewhere close
to the circle until a surrounding square appears
- Click that square and drag left to move the chart to the left

- In the same way, click the box that displays the title above the
chart and drag it left to place it above the chart
- Also, click the box that displays East West North and drag it left
to place it close to the chart
- After resizing, close the Microsoft Graph window
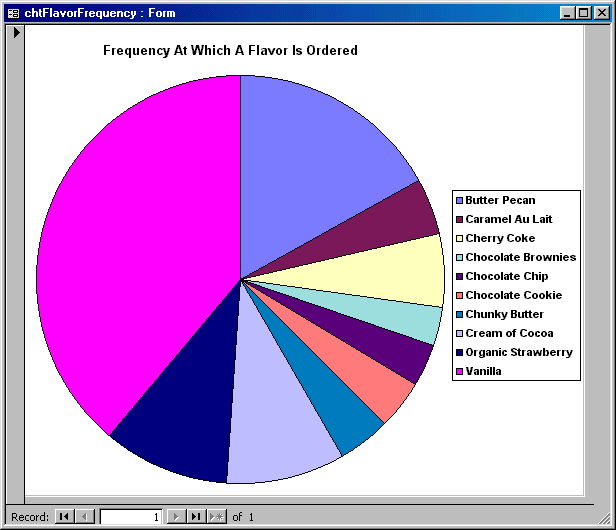
- Back in Microsoft Access, resize the box that surrounds the chart
until the chart and the words around it are visible. You may need to
continue various trial-and-error attempts until you come to the
following

- Save and close the form
|

