Formatting Charts
 |
Formatting Charts |
Change of Chart Type
 |
A chart created with all defaults settings usually accomplishes its purpose of helping you analyze data and figures, but the default features are set only as starting points. All the formatting and emphasis needs are left to you. Besides the values and numbers on it, a chart is a graphic object whose characteristics can be enhanced to accentuate special important points of the whole process. Most aspects of a chart can be changed. For example, if you selected a certain type of chart but think that another is more suitable, you can change it. |
The Chart Wizard is equipped with various kinds of charts. In each category, different sub-types are used to accomplish a unique purpose. Although they share a lot of characteristics, some charts in the sub-type can tremendously change or alter the intended goal. You should know what options are available, and then act accordingly.
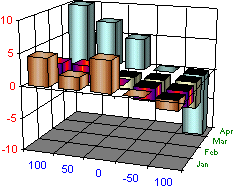
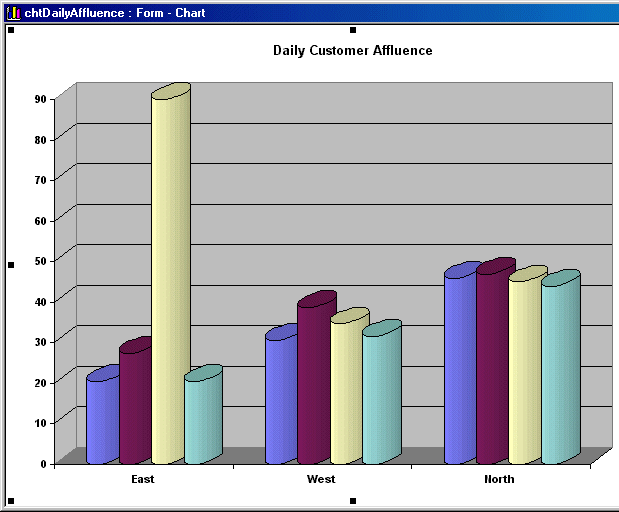
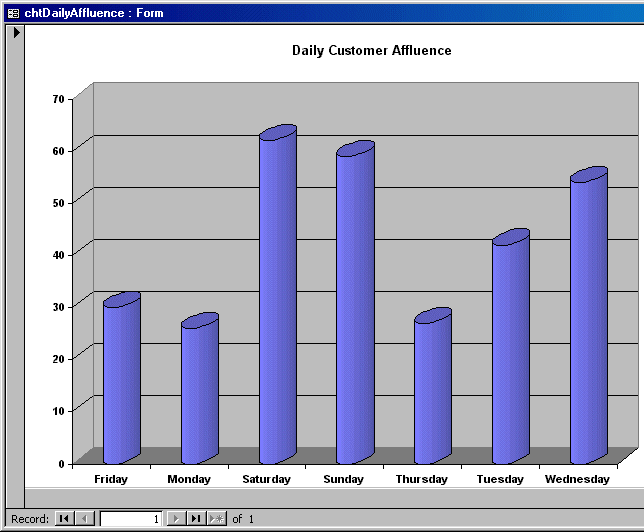
Many charts can be changed from one kind to another, sometimes completely different. For example, you can change a chart from a flat column to 3-D. You can also change a chart from a bar to a cylinder, etc.
To actually change a chart, after displaying its parent form in Design View, you can double-click it. This would open the Microsoft Graph application. From there, you can right-click any part of the chart to make the necessary changes. Any area you right-click presents a particular menu. This is because a chart is made of various sections.
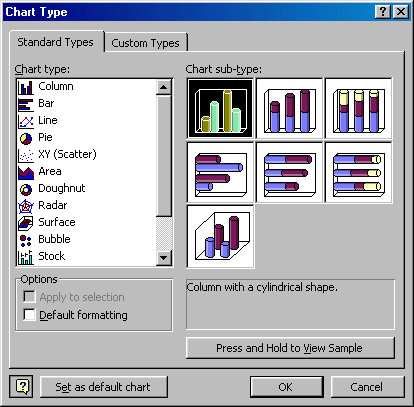
To change the type of chart, you can right-click a white area on the Form - Chart window and click Chart Type. This would bring up the Chart Type dialog box. It presents the various available types of charts and you can click one of them. If none of the available types suits you, you can click the Custom Type tab for more options.
![]() Practical Learning: Changing a Chart Type
Practical Learning: Changing a Chart Type
 |


|
|
||
| Previous | Copyright © 2002-2005 FunctionX, Inc. | Next |
|
|
||