|
|
Microsoft SQL Server is a powerful application that can
be used in various scenarios. For example, a statistitian can use it to keep
records and analyze the meaning of numbers stored in tables. To assist you
with this, Transact-SQL provides many statistic-based functions, referred to
as aggregate functions. They allow you to create particular views named
aggregate queries.
|
|
 Practical
Learning: Introducing Aggregate Queries Practical
Learning: Introducing Aggregate Queries
|
|
- Start the computer and log in
- Launch Microsoft SQL Server and click Connect.
Make sure you
have the RealEstate2
database from previous lessons
- In the Object Explorer, expand Databases and expand RealEstate2
|
Creating an Aggregate
Query
|
|
Before creating an aggregate query, in the Object
Explorer, expand the database on which you will work. Right-click Views
and click New View... On the Add Table dialog box, select the table(s) (or
view(s)) and close it. To start a summary query:
- Right-click somewhere in the middle window and click Add Group By
- On the View Designer toolbar, click the Add Group By button

- On the main menu, click View Designer, and click Add Group By
This gets the view ready for summary.
The formula to programmatically create an aggregate
query is:
SELECT WhatField(s)
FROM WhatObject(s)
GROUP BY Column(s)
The new expression in this formula is GROUP BY.
This indicates that you want to group some values from one or more
columns. There are rules you must follow.
Although you can create an aggregate query with all
fields or any field(s) of a view, the purpose of the view is to summarize
data. For a good summary view, you should select a column where the
records hold categories of data. This means that the records in the
resulting view have to be grouped by categories. To support this, the SQL
provides the GROUP BY expression. It means where the records
display, they would be grouped by their categories. For example, if you
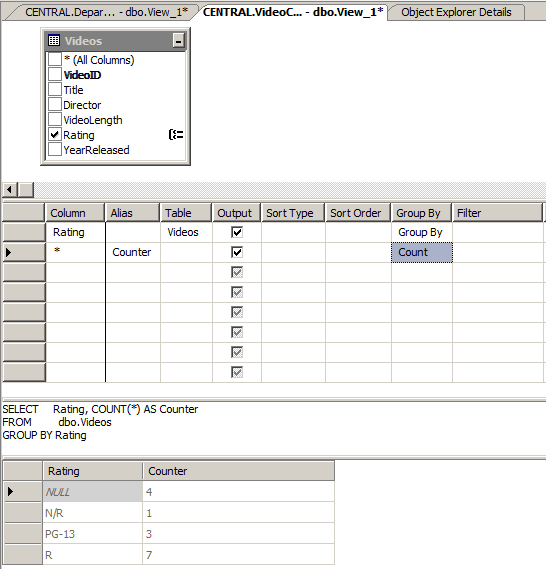
want to get the number of videos by rating, you would select the column
that holds that information: Rating.
As stated already, the purpose of an aggregate query
is to provide some statistics. Therefore, it is normal that you be
interested only in the column(s) that hold(s) the desired statistics and
avoid the columns that are irrelevant. As a result, if you select (only)
the one column that holds the information you want, in the resulting list,
each of its categories would display only once.
|
 Practical
Learning: Creating an Aggregate Query Practical
Learning: Creating an Aggregate Query
|
|
- Under RealEstate2, right-click Views and click New View...
- In the Add Table dialog box, click Properties (Listing) and click
Add
- Click Close
- On the View Designer toolbar, click the Add Group By button

To get the types of statistics you want, you must put
similar values of records together. That is, you must group the records.
For example, if you want to find the total number of boys in a list of
students, obviously you must count the number of occurrences of a
particular gender in the appropriate column. That's why you use the
GROUP BY clause. In the SQL statement, as seen
previously, create a GROUP BY clause and add the
list of necessary columns, usually not more than 2.
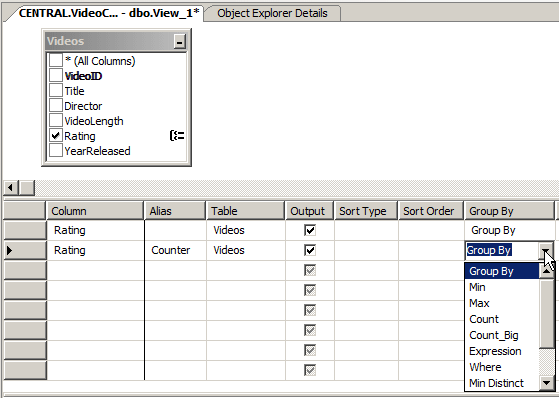
To visually summarize the values, in the Criteria
pane, add the same column one more time and give it a caption in the Alias
section. Then, click the Group By box that corresponds to the duplicate
column:
|
Transact-SQL and Statistics
|
|
|
The Number of Values (The Size of a Sample)
|
|
Probably the most basic piece of information you may
want to get about a list is the number of records it has. In statistics,
this is referred to as the number of samples. To help you get this
information, Transact-SQL provides a function named Count. It
counts the number of records in a column and produces the total. This
function also counts NULL values. The syntax of the Count()
function is:
int COUNT ( { [ [ ALL | DISTINCT ] expression ] | * } )
This function takes one argument. To get the count of
occurrences of a value, in the Criteria pane, you can select COUNT(*).
The Count() function returns an int
value. If you are working on a large number of records, you can call the
Count_Big() function. Its syntax is:
bigint COUNT_BIG ( { [ ALL | DISTINCT ] expression } | * )
|
 Practical
Learning: Getting the Number of Records Practical
Learning: Getting the Number of Records
|
|
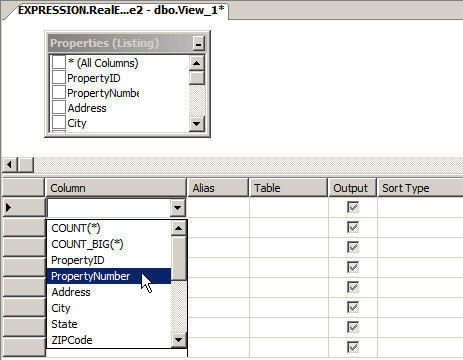
- In the Criteria pane, click the first box under Column, then click
the arrow of its combo box and select PropertyNumber
- Under Alias, type Number of Properties
- Under Group By, click the arrow of the combo box and select Count
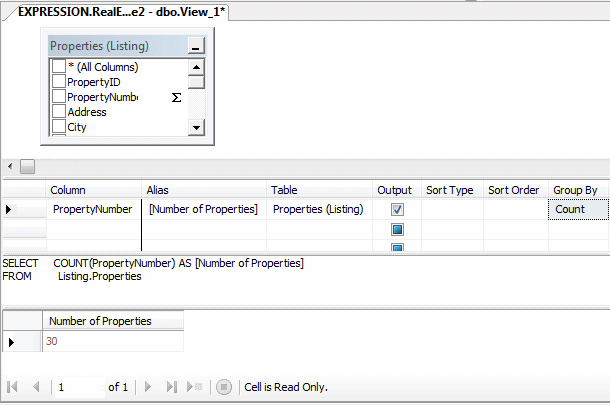
- To execute, on the View Designer toolbar, click the Execute SQL
button

- Close the view
- When asked whether you want to save, click No
- To start a new view, in the Object Explorer, right-click Views and
click New View...
- In the Add Tables dialog box, double-click PropertyTypes (Listing)
and Properties (Listing)
- Click Close
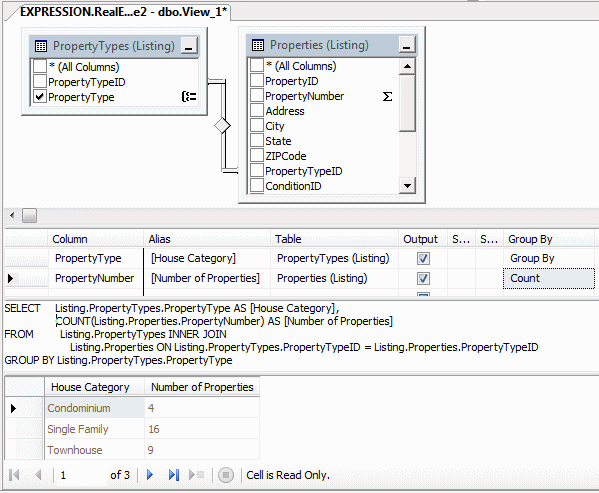
- To prepare to see the number of properties in each category, in
the View Designer toolbar, click the Add Group By button

- From the PropertyTypes list, drag PropertyTypeID and drop it on
top of PropertyTypes in the Properties table
- In the PropertyTypes list, click the check box of PropertyType
- In the Criteria pane, click the box under PropertyType and select
Listing.Properties.PropertyNumber
- Press Tab and type Number of Properties
- In the Corresponding Group By box, select Count
- Set the alias of PropertyType to House Category
- To execute, on the View Designer toolbar, click the Execute SQL
button

- Right-click the PropertyTypes (Listing) title bar and click Remove
- In the Criteria pane, right-click the box at the left of
PropertyNumber and click Delete
|
The Minimum Value of a Series
|
|
If you have a list of numeric values, you may want to
get the lowest value. For example, in a list of houses of a real estate
company with each property having a price, you may want to know which
house is the cheapest. To let you get this information, Transact-SQL
provides the Min() function. The syntax of this function is:
DependsOnType MIN ( [ ALL | DISTINCT ] expression )
|
 Practical
Learning: Getting the Minimum of a Series Practical
Learning: Getting the Minimum of a Series
|
|
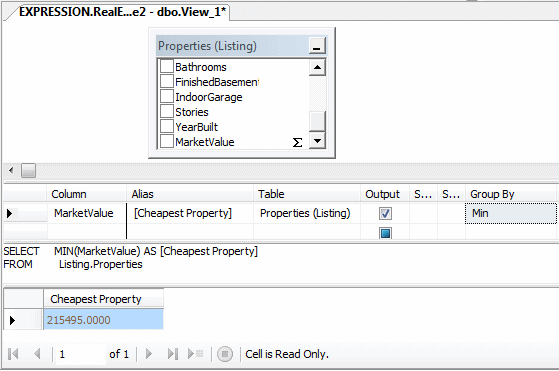
- In the Criteria Pane, click the first combo box under Column and
select MarketValue
- Press Tab and type Cheapest Property to change
the string of the Alias field
- Under Group By, click the arrow of the combo box and select Min
- To execute, right-click somewhere in the window and click Execute
SQL
- To prepare to see the cheapest house per category, right-click the
Diagram pane and click Add Table...
- In the Add Table dialog box, double-click PropertyTypes (Listing)
- Click Close
- Drag PropertyTypeID from the PropertyTypes table and drop it on
PropertyTypeID in the Properties table
- In the PropertyTypes (Listing) table, click the check box of
PropertyType
- In the Criteria pane, move the PropertyType row to the top
- To execute, right-click somewhere in the window and click Execute
SQL

- Right-click the title bar of PropertyTypes (Listing) and click
Remove
|
The Maximum Value of a Series
|
|
The opposite of the lowest is the highest value of a
series. To assist you with getting this value, Transact-SQL provides the
Max() function. Its function is:
DependsOnType MAX ( [ ALL | DISTINCT ] expression )
|
 Practical
Learning: Getting the Highest Value of a Series Practical
Learning: Getting the Highest Value of a Series
|
|
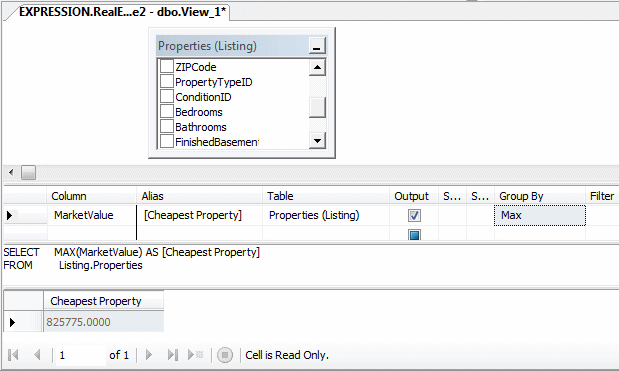
- In the Criteria Pane, click the combo box of Min and select Max
- Click Alias and change it to Most Expensive
- To execute, right-click somewhere in the window and click Execute
SQL
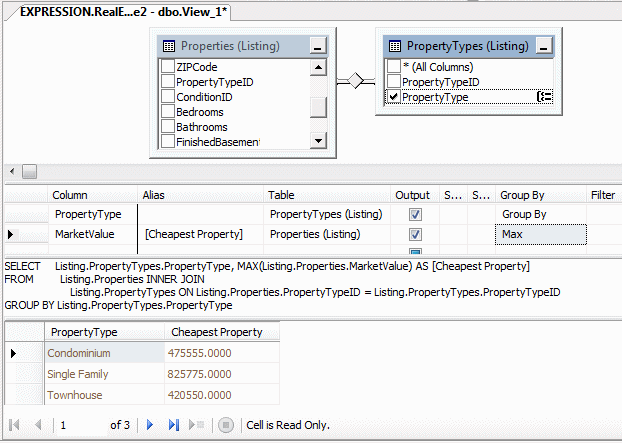
- To see the most expensive house in each category, right-click the
Diagram pane and click Add Table...
- In the Add Table dialog box, double-click PropertyTypes (Listing)
- Click Close
- Drag PropertyTypeID from the PropertyTypes table and drop it on
PropertyTypeID in the Properties table
- In the PropertyTypes (Listing) table, click the check box of
PropertyType
- In the Criteria pane, move the PropertyType row to the top
- To execute, right-click somewhere in the window and click Execute
SQL
- Right-click the title bar of PropertyTypes table and click Remove
The sum of the values of a series is gotten by adding
all values. In algebra and statistics, it is represented as follows:
∑x
To let you calculate the sum of values of a certain
column of a table, Transact-SQL provides a function named Sum. The
syntax of the Sum() function is:
Number SUM ( [ ALL | DISTINCT ] expression )
|
 Practical
Learning: Getting the Sum of Value Practical
Learning: Getting the Sum of Value
|
|
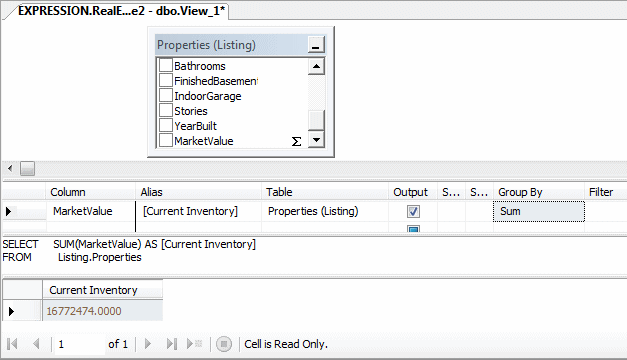
- In the Criteria pane, click MarketValue, press Tab and type
Current Inventory to change the value of the Alias
- Under Group By, click Max, then click the arrow of its combo box
and select Sum
- To execute, right-click somewhere in the window and click Execute
SQL
In algebra and statistics, the mean is the average of
the numeric values of a series. To calculate it, you can divide the sum by
the number of values of the series. It is calculated using the following
formula:

From this formula:
- x representes each value of the series (called a sample)
- n represents the number (count) of values
- x represents the mean of the x values
- ∑x represents the sum of x values
To support this operation, Transact-SQL provides the
Avg function. Its syntax is:
Number AVG ( [ ALL | DISTINCT ] expression )
|
 Practical
Learning: Getting the Mean of Value Practical
Learning: Getting the Mean of Value
|
|
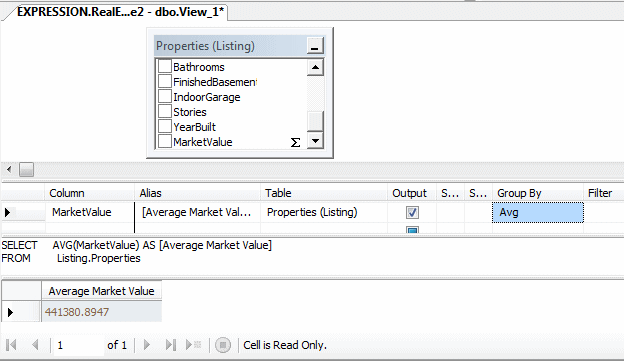
- In the Criteria pane, click MarketValue, press Tab and type
Average Market Value to change the value of the Alias
- Under Group By, click Max, then click the arrow of its combo box
and select Avg
- To execute, right-click somewhere in the window and click Execute
SQL
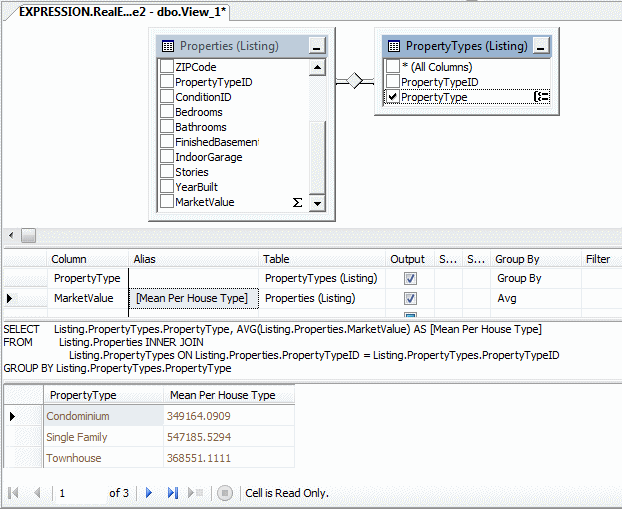
- Before seeing the average price of house for each category,
right-click the Diagram pane and click Add Table...
- In the Add Table dialog box, click PropertyTypes (Listing)
- Click Add and click Close
- Drag PropertyTypeID from the PropertyTypes table and drop it on
PropertyTypeID in the Properties table
- In the PropertyTypes click the check box of PropertyType
- In the Criteria pane, move the PropertyType row to the top
- Change the alias of MarketValue to Mean Per House Type
- To execute, right-click somewhere in the window and click Execute
SQL
- Right-click the title bar of PropertyTypes table and click Remove


