|
In our introduction to charts,
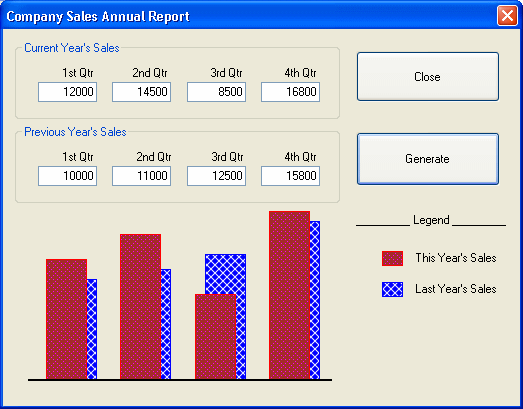
we used rectangles to draw a column chart. We will continue with the same
approach here. This time, we will create a 2-column chart. This type of chart is
used to analyze numbers that each represents the same category of information
but from two periods.
|
|
 Practical
Learning: Creating the Chart Practical
Learning: Creating the Chart
|
|
- Start a new Windows Forms Application named YearlySales
- Design the form as follows:
 |
| Control |
Name |
Text |
Other Properties |
| GroupBox |
 |
|
Current Year's Sales |
|
| Label |
 |
|
1st Qtr |
|
| Label |
 |
|
2nd Qtr |
|
| Label |
 |
|
3rd Qtr |
|
| Label |
 |
|
4th Qtr |
|
| TextBox |
 |
txtCurrentQtr1 |
1200 |
|
| TextBox |
 |
txtCurrentQtr2 |
14500 |
TextAlign: Right |
| TextBox |
 |
txtCurrentQtr3 |
8500 |
TextAlign: Right |
| TextBox |
 |
txtCurrentQtr4 |
16800 |
TextAlign: Right |
| Button |
 |
Close |
btnClose |
|
| GroupBox |
 |
|
Previous Year's Sales |
|
| Label |
 |
|
1st Qtr |
|
| Label |
 |
|
2nd Qtr |
|
| Label |
 |
|
3rd Qtr |
|
| Label |
 |
|
4th Qtr |
|
| TextBox |
 |
txtPreviousQtr1 |
10000 |
|
| TextBox |
 |
txtPreviousQtr2 |
11000 |
TextAlign: Right |
| TextBox |
 |
txtPreviousQtr3 |
12500 |
TextAlign: Right |
| TextBox |
 |
txtPreviousQtr4 |
15800 |
TextAlign: Right |
| Button |
 |
Generate |
btnGenerate |
|
| Label |
 |
|
_________ Legend _________ |
|
| Label |
 |
lblCurYear |
This Year's Sales |
|
| Label |
 |
lblLastYear |
Last Year's Sales |
|
|
- Right-click the form and click View Code and declare the following two
variables:
private:
	/// <summary>
	/// Required designer variable.
	/// </summary>
	System::ComponentModel::Container ^components;
	Graphics ^ graphDrawingArea;
	Bitmap   ^ bmpDrawingArea;
|
- Return to the form
- Double-click an unoccupied area on the form and implement its Load event
as follows:
System::Void Form1_Load(System::Object^  sender, System::EventArgs^  e)
{
	 bmpDrawingArea   = gcnew Bitmap(Width, Height);
	 graphDrawingArea = Graphics::FromImage(bmpDrawingArea);
}
|
- Return to the form and click an empty area on it. In the Properties
window, click the Events button

- Double-click the Paint field and implement its event as follows:
System::Void Form1_Paint(System::Object^  sender,
	System::Windows::Forms::PaintEventArgs^  e)
{
	 e->Graphics->DrawImage(bmpDrawingArea, 0, 0);
}
|
- Return to the form
- Double-click the Generate button and implement its Click event as follows:
System::Void btnGenerate_Click(System::Object^  sender,
				System::EventArgs^  e)
{
    using namespace System::Drawing::Drawing2D;

    // Retrieve the values of the current year's sales
    int curQtr1 = int::Parse(this->txtCurrentQtr1->Text) / 100;
    int curQtr2 = int::Parse(this->txtCurrentQtr2->Text) / 100;
    int curQtr3 = int::Parse(this->txtCurrentQtr3->Text) / 100;
    int curQtr4 = int::Parse(this->txtCurrentQtr4->Text) / 100;

    // Create an array of Rectangle objects for the current year
    array<Rectangle> ^ rectCurrentYear = gcnew array<Rectangle>(4)
    {
	Rectangle(this->txtCurrentQtr1->Left+20,
		  350-curQtr1, 40, curQtr1),
	Rectangle(this->txtCurrentQtr2->Left+20,
		  350-curQtr2, 40, curQtr2),
	Rectangle(this->txtCurrentQtr3->Left+20,
		  350-curQtr3, 40, curQtr3),
	Rectangle(this->txtCurrentQtr4->Left+20,
		  350-curQtr4, 40, curQtr4) };

	 // Retrieve the values of last year's sales
	 int prvQtr1 = int::Parse(this->txtPreviousQtr1->Text) / 100;
	 int prvQtr2 = int::Parse(this->txtPreviousQtr2->Text) / 100;
	 int prvQtr3 = int::Parse(this->txtPreviousQtr3->Text) / 100;
	 int prvQtr4 = int::Parse(this->txtPreviousQtr4->Text) / 100;

	 // Create an array of Rectangle objects for the previous year
	 array<Rectangle> ^ rectPreviousYear =
		gcnew array<Rectangle>(4)
	 {
	     Rectangle(this->txtPreviousQtr1->Left+30,
		       350-prvQtr1, 40, prvQtr1),
 	     Rectangle(this->txtPreviousQtr2->Left+30,
		       350-prvQtr2, 40, prvQtr2),
	     Rectangle(this->txtPreviousQtr3->Left+30,
		       350-prvQtr3, 40, prvQtr3),
	     Rectangle(this->txtPreviousQtr4->Left+30,
		       350-prvQtr4, 40, prvQtr4)
	 };

// In case the user has changed the values, erase the previous chart
	 graphDrawingArea->Clear(this->BackColor);

	 HatchBrush ^ brushDiagCross  =
			gcnew HatchBrush(HatchStyle::DiagonalCross,
			Color::White, Color::Blue);
	 HatchBrush ^ brushDotDiamond =
			gcnew HatchBrush(HatchStyle::DottedDiamond,
			Color::Fuchsia, Color::Brown);

	 // Draw the chart for the previous year first to send it back
	 graphDrawingArea->FillRectangles(brushDiagCross,
					  rectPreviousYear);
	 graphDrawingArea->DrawRectangles(gcnew Pen(Color::Blue),
					  rectPreviousYear);
	 // Draw the chart for the current year in front
	 graphDrawingArea->FillRectangles(brushDotDiamond,
					  rectCurrentYear);
	 graphDrawingArea->DrawRectangles(gcnew Pen(Color::Red),
					  rectCurrentYear);

	 // Draw the small rectangles of the legend
	 graphDrawingArea->FillRectangle(brushDotDiamond,
					 this->lblCurYear->Left-30,
					 this->lblCurYear->Top,  20, 14);
	 graphDrawingArea->DrawRectangle(gcnew Pen(Color::Red),
					 this->lblCurYear->Left-30,
					 this->lblCurYear->Top,  20, 14);
	 graphDrawingArea->FillRectangle(brushDiagCross,
					 this->lblLastYear->Left-30,
					 this->lblLastYear->Top, 20, 14);
	 graphDrawingArea->DrawRectangle(gcnew Pen(Color::Blue),
					 this->lblLastYear->Left-30,
					 this->lblLastYear->Top, 20, 14);

	 graphDrawingArea->DrawRectangle(gcnew Pen(Color::Black), 25,
					 350, Width - 220, 1);
	 Invalidate();
}
|
- Return to the form. Double-click the Close button and implement its Click
event as follows:
System::Void btnClose_Click(System::Object^  sender, System::EventArgs^  e)
{
	 Close();
}
|
- Execute the application and test the form

- After using it, close the form
|
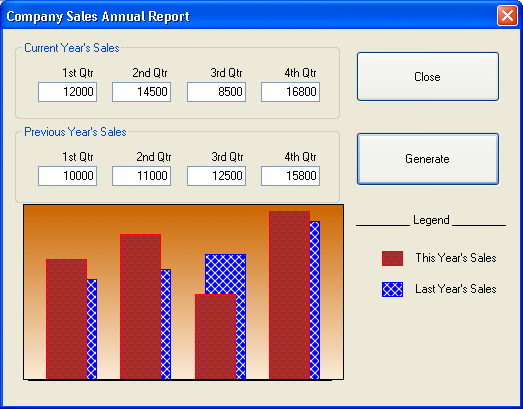
One of the improvements you can bring to a chart is to
provide it with a fancy background. This also can be a shape you draw. You can
then paint it using one of the brushes of the
GDI+ library.
|
|
 Practical
Learning: Painting the Background Practical
Learning: Painting the Background
|
|
- Change the Click event of the Generate button as
follows:
System::Void btnGenerate_Click(System::Object^  sender,
				System::EventArgs^ e)
{
    using namespace System::Drawing::Drawing2D;

    // Retrieve the values of the current year's sales
    int curQtr1 = int::Parse(this->txtCurrentQtr1->Text) / 100;
    int curQtr2 = int::Parse(this->txtCurrentQtr2->Text) / 100;
    int curQtr3 = int::Parse(this->txtCurrentQtr3->Text) / 100;
    int curQtr4 = int::Parse(this->txtCurrentQtr4->Text) / 100;

    // Create an array of Rectangle objects for the current year
    array<Rectangle> ^ rectCurrentYear = gcnew array<Rectangle>(4)
    {
	Rectangle(this->txtCurrentQtr1->Left+20,
		  350-curQtr1, 40, curQtr1),
	Rectangle(this->txtCurrentQtr2->Left+20,
		  350-curQtr2, 40, curQtr2),
	Rectangle(this->txtCurrentQtr3->Left+20,
		  350-curQtr3, 40, curQtr3),
	Rectangle(this->txtCurrentQtr4->Left+20,
		  350-curQtr4, 40, curQtr4) };

	 // Retrieve the values of last year's sales
	 int prvQtr1 = int::Parse(this->txtPreviousQtr1->Text) / 100;
	 int prvQtr2 = int::Parse(this->txtPreviousQtr2->Text) / 100;
	 int prvQtr3 = int::Parse(this->txtPreviousQtr3->Text) / 100;
	 int prvQtr4 = int::Parse(this->txtPreviousQtr4->Text) / 100;

	 // Create an array of Rectangle objects for the previous year
	 array<Rectangle> ^ rectPreviousYear =
		gcnew array<Rectangle>(4)
	 {
	     Rectangle(this->txtPreviousQtr1->Left+30,
		       350-prvQtr1, 40, prvQtr1),
 	     Rectangle(this->txtPreviousQtr2->Left+30,
		       350-prvQtr2, 40, prvQtr2),
	     Rectangle(this->txtPreviousQtr3->Left+30,
		       350-prvQtr3, 40, prvQtr3),
	     Rectangle(this->txtPreviousQtr4->Left+30,
		       350-prvQtr4, 40, prvQtr4)
	 };

   // In case the user has changed the values, erase the previous chart
	 graphDrawingArea->Clear(this->BackColor);

	 Rectangle rect(20, 175, 320, 175);
    LinearGradientBrush ^ linGradBrush = gcnew LinearGradientBrush(rect,
				 Color::FromArgb(204, 102, 0),
				 Color::AntiqueWhite,
				 LinearGradientMode::Vertical);
	 graphDrawingArea->FillRectangle(linGradBrush, rect);
	 graphDrawingArea->DrawRectangle(gcnew Pen(Color::Black), rect);

	 HatchBrush ^ brushDiagCross  =
			gcnew HatchBrush(HatchStyle::DiagonalCross,
			Color::White, Color::Blue);
	 HatchBrush ^ brushDotDiamond =
			gcnew HatchBrush(HatchStyle::DottedDiamond,
			Color::Fuchsia, Color::Brown);

	 // Draw the chart for the previous year first to send it back
	 graphDrawingArea->FillRectangles(brushDiagCross,
					  rectPreviousYear);
	 graphDrawingArea->DrawRectangles(gcnew Pen(Color::Blue),
					  rectPreviousYear);
	 // Draw the chart for the current year in front
	 graphDrawingArea->FillRectangles(brushDotDiamond,
					  rectCurrentYear);
	 graphDrawingArea->DrawRectangles(gcnew Pen(Color::Red),
					  rectCurrentYear);

	 // Draw the small rectangles of the legend
	 graphDrawingArea->FillRectangle(brushDotDiamond,
					 this->lblCurYear->Left-30,
					 this->lblCurYear->Top,  20, 14);
	 graphDrawingArea->DrawRectangle(gcnew Pen(Color::Red),
					 this->lblCurYear->Left-30,
					 this->lblCurYear->Top,  20, 14);
	 graphDrawingArea->FillRectangle(brushDiagCross,
					 this->lblLastYear->Left-30,
					 this->lblLastYear->Top, 20, 14);
	 graphDrawingArea->DrawRectangle(gcnew Pen(Color::Blue),
					 this->lblLastYear->Left-30,
					 this->lblLastYear->Top, 20, 14);

	 graphDrawingArea->DrawRectangle(gcnew Pen(Color::Black), 25,
					 350, Width - 220, 1);
	 Invalidate();
}
|
- Execute the application to test it:

- After using the form, close it
|
|

