Introduction to Drawing Lines
Introduction to Drawing Lines
Introduction to Lines
A Line from Points
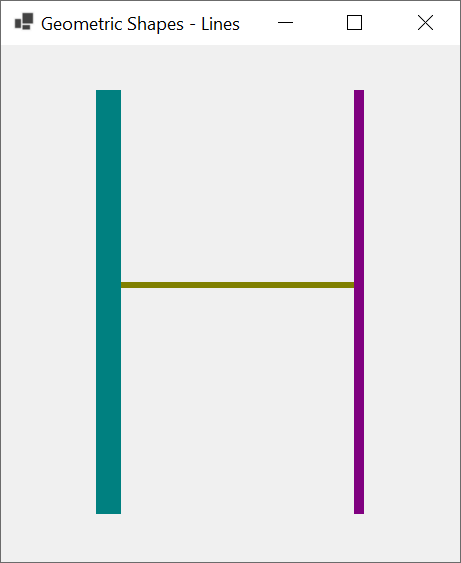
In the previous lesson, we had an introduction to drawing lines. We saw how to draw a line by calling the Graphics.DrawLine() method. The version we used takes two Point objects as arguments. That version of the Graphics.DrawLine() method uses points with natural numbers. In some cases, you may want to use more precise values that use decimal numbers. In this case, you can use points that use floating-point numbers with single precision. To support this, the Graphics class provides the following version of its DrawLine() method:
public void DrawLine(Pen pen,
                     PointF pt1,
                     PointF pt2);
Notice that this version uses PointF arguments. Here are examples that call that method:
namespace GraphicsAccessories
{
    public partial class Exercise : Form
    {
        public Exercise()
        {
            InitializeComponent();
        }

        private void Exercise_Paint(object sender, PaintEventArgs e)
        {
            // This is the pen that will be used to draw lines
            Pen penCurrent = new Pen(Color.Olive, 6.669F);

            /* These are some point for the lines.
             * The name of each point indicates its position with regards to its designated line. */
            PointF ptLowerLeft   = new(106.925F, 468.927F);
            PointF ptUpperLeft   = new(106.925F,  44.262F);
            PointF ptMiddleLeft  = new(107.864F, 239.546F);
            PointF ptMiddleRight = new(357.864F, 239.546F);
            PointF ptUpperRight  = new(357.747F,  44.262F);
            PointF ptLowerRight  = new(357.747F, 468.927F);

            e.Graphics.DrawLine(penCurrent, ptMiddleLeft, ptMiddleRight);

            penCurrent = new(Color.Teal, 24.628F);
            e.Graphics.DrawLine(penCurrent, ptLowerLeft, ptUpperLeft);

            penCurrent = new(Color.Purple, 10.317F);
            e.Graphics.DrawLine(penCurrent, ptUpperRight, ptLowerRight);
        }
    }
}
This would produce:
A Line from Coordinates
Instead of defining a line as going from one point to another, you can indicate the values of the starting to the ending coordinates. To support this, the Graphics class provides the following version of its DrawLine() method:
public void DrawLine(Pen pen,
                     int x1,
                     int y1,
                     int x2,
                     int y2);
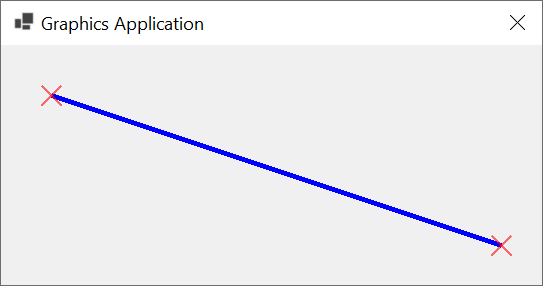
In this case, the x1 and the y1 arguments represent the coordinates of the starting point. The x2 and the y2 values represent the coordinates of the ending point. Here are examples:
private void Exercise_Paint(object sender, PaintEventArgs e)
{
    Pen penRed  = new Pen(Color.FromArgb(155, 255, 15, 15), 2.50F);

    Pen penCurrent = new Pen(Color.Blue, 4.50F);

    (int x1, int y1, int x2, int y2) = (50, 50, 500, 200);

    e.Graphics.DrawLine(penCurrent, x1, y1, x2, y2);

    e.Graphics.DrawLine(penRed, x1 - 10, y1 - 10, x1 + 10, y1 + 10);
    e.Graphics.DrawLine(penRed, x1 + 10, y1 - 10, x1 - 10, y1 + 10);
    e.Graphics.DrawLine(penRed, x2 - 10, y2 - 10, x2 + 10, y2 + 10);
    e.Graphics.DrawLine(penRed, x2 + 10, y2 - 10, x2 - 10, y2 + 10);
}
This would produce:
If you want to draw the line using floating numbers, the Graphics class provides a DrawLine() method that uses floating-point values for the x1, the y1, the x2 and the y2 values. Its syntax is:
public void DrawLine(Pen pen,
                     float x1,
                     float y1,
                     float x2,
                     float y2);
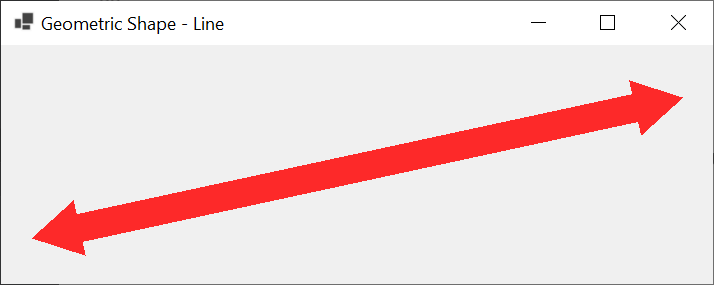
This version of the method expects some decimal numbers as argumnents. Here is an example:
using System.Drawing.Drawing2D;

namespace GeometricShapes
{
    public partial class Exercise : Form
    {
        public Exercise()
        {
            InitializeComponent();
        }

        private void pbxCanvas_Paint(object sender, PaintEventArgs e)
        {
            Pen pen = new(Color.FromArgb(225, 255, 15, 15), 28.35F);
            Line ten = new Line(e.Graphics, 4.174F, 168.862F, 655.59F, 28.174F, pen.Color, pen.Width);

            ten.BorderStart = LineCap.ArrowAnchor;
            ten.BorderEnd   = LineCap.ArrowAnchor;

            ten.Draw();
        }
    }

    public class Line
    {
        public Line(Graphics graph, float startX, float startY, float endX, float endY, Color color, float width)
        {
            StartX  = startX;
            StartY  = startY;
            EndX    = endX;
            EndY    = endY;
            Color   = color;
            Width   = width;
            Grapher = graph;
        }

        public float    StartX      { get; set; }
        public float    StartY      { get; set; }
        public float    EndX        { get; set; }
        public float    EndY        { get; set; }
        public Color    Color       { get; set; }
        public float    Width       { get; set; }
        public LineCap  BorderStart { get; set; }
        public LineCap  BorderEnd   { get; set; }
        public Graphics Grapher     { get; set; }

        public void Draw()
        {
            Pen pn = new Pen(Color, Width);

            pn.StartCap = BorderStart;
            pn.EndCap   = BorderEnd;
            Grapher.DrawLine(pn, StartX, StartY, EndX, EndY);
        }
    }
}
This would produce:
![]() Practical Learning: Introducing Drawing Shapes
Practical Learning: Introducing Drawing Shapes
A Series of Lines
The above DrawLine() method is used to draw one line. To let you draw a group of lines at once, the Graphics class provides an overloaded method named DrawLines. One of its versions uses the following syntax:
public void DrawLines(Penpen, Point[] points);
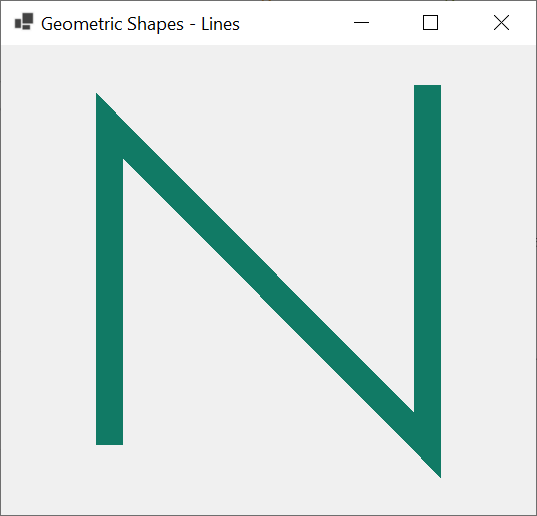
To use this method, you should first define an array of Point objects with each point using natural numbers. Here is an example:
private void Exercise_Paint(object sender, PaintEventArgs e)
{
    Point[] Coordinates = { new(108, 400), new(108, 80),
                            new(426, 400), new(426, 40) };

    Pen penCurrent = new Pen(Color.FromArgb(17, 122, 101), 26.836F);

    e.Graphics.DrawLines(penCurrent, Coordinates);
}
This would produce:
If you want the points to use more precise values, the Graphics class provides another version of its DrawLines() method. Its syntax is:
public void DrawLines(Pen pen, PointF[] points);
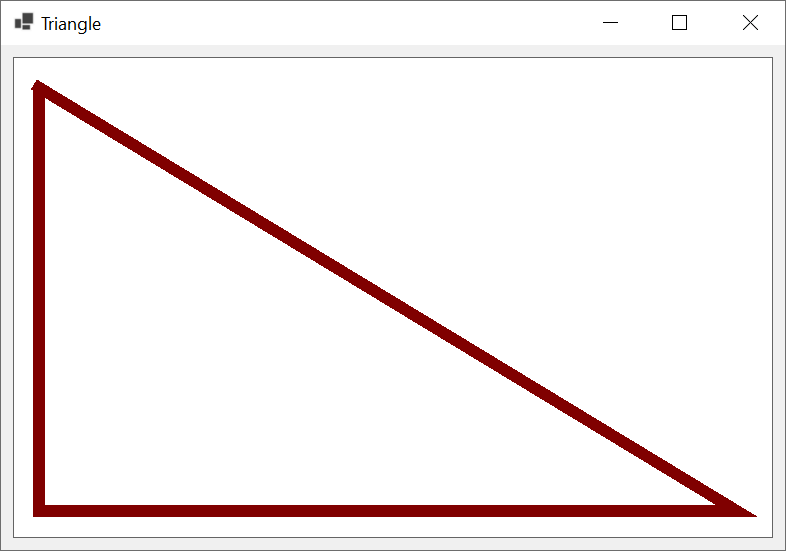
This method expects an array of points where each point holds decimal numbers. Here is an example:
private void pbxCanvas_Paint(object sender, PaintEventArgs e)
{
    Graphics grapher = e.Graphics;

    // The points that will mark the coordinates of the lines
    PointF[] pts = { new( 24.328F,  26.881F),
                     new( 24.328F, 452.639F),
                     new(722.725F, 452.639F),
                     new( 19.328F,  25.881F) };

    // The pen that shows the shape of the line
    Pen penCurrent = new Pen(Brushes.Maroon, 11.628F);
    // Draw the line
    grapher.DrawLines(penCurrent, pts);
}
This would display:
Polygons
Introduction
A polygon is a series of connected lines with the whole shape being closed. In other words, a polygon is defined as a group of lines so that, except for the first line of the group, the starting point of each line is the same as the end point of the previous line and the end point of the last line is connected to the start point of the first line.
Drawing a Polygon
To support polygons, the Graphics class provides an overloaded method named Polygon. One of its versions uses the following syntax:
public void DrawPolygon(Pen pen, Point[] points);
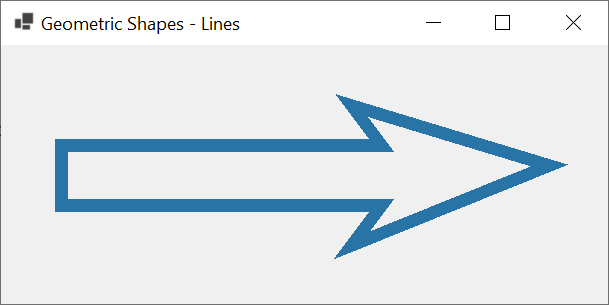
This method takes an array of Point objects as its second argument. Here is an example:
private void Exercise_Paint(object sender, PaintEventArgs e)
{
    Point[] pts = { new( 60, 100),
                    new(380, 100),
                    new(350,  60),
                    new(548, 120),
                    new(350, 200),
                    new(380, 160),
                    new( 60, 160) };

    Pen penCurrent = new Pen(Color.FromArgb(40, 116, 166), 12.426F);
    e.Graphics.DrawPolygon(penCurrent, pts);
}
This would produce:
The points in the above version of the Graphics.DrawPolygon() method use integers. To let your polygon use more precise values as decimal numbers, the Graphics class provides the following version of the method:
public void DrawPolygon(Pen pen, PointF[] points);
The points in this version can use floating-point numbers. Here is an example:
private void pbxCanvas_Paint(object sender, PaintEventArgs e)
{
    Graphics grapher = e.Graphics;

    // The points that will mark the coordinates of the lines
    PointF[] pts = { new PointF( 22.225F, 102.225F), new PointF(202.225F,  22.225F),
                     new PointF(552.225F,  22.225F), new PointF(752.225F, 102.225F),
                     new PointF(552.225F, 202.225F), new PointF(202.225F, 202.225F),
                     new PointF( 22.225F, 102.225F), new PointF( 22.225F, 102.225F),
                     new PointF( 22.225F, 452.225F), new PointF(202.225F, 552.225F),
                     new PointF(552.225F, 552.225F), new PointF(752.225F, 452.225F),
                     new PointF(752.225F, 102.225F)                                 };

    // The pen that shows the shape of the line
    Pen pnBorder = new Pen(Brushes.Maroon, 5.625F);
    // Draw the line
    grapher.DrawLines(pnBorder, pts);
    grapher.DrawLine(pnBorder, pts[5], pts[9]);
    grapher.DrawLine(pnBorder, pts[4], pts[10]);
}
This would produce:
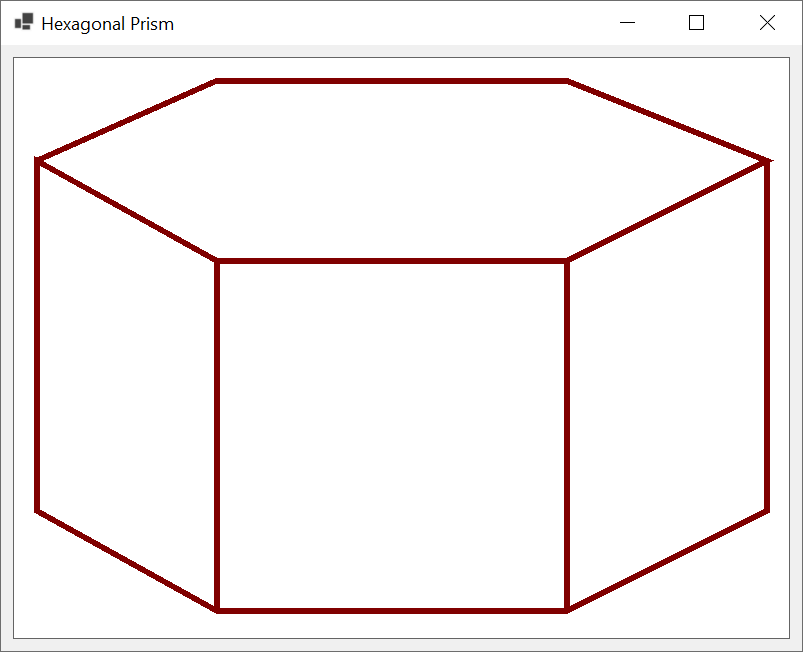
You can call any of the above versions to draw any type of polygon: triangle, square, rectangle, prism, etc. You can also use those methods to draw 3-D shapes such as cubes, boxes, etc.
Introduction to Rectangles
Overview
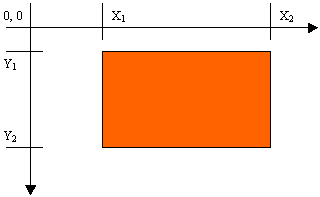
A rectangle is a geometric figure made of four sides that compose four right angles. In a computer application, a rectangle can be illustrated as follows:
A Rectangle from a Rectangle
To help you draw a rectangle, the Graphics class is equipped with an overloaded method named DrawRectangle. One of its versions uses the following syntax:
public void DrawRectangle(Pen pen, Rectangle rect);
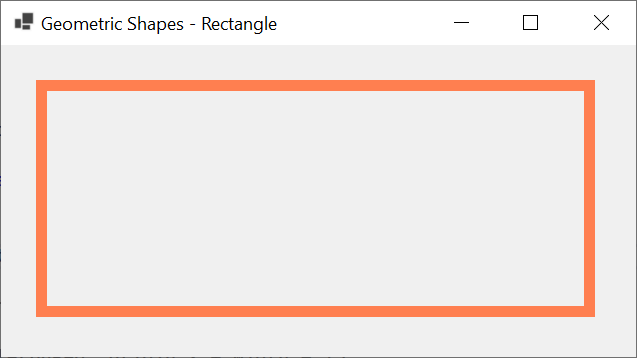
Remember that all Graphics.Draw... methods take a Pen object as their first argument. Other than that, the second argument of the above DrawRectangle() method takes a Rectangle object as argument. This means you can pass a Rectangle object that specifies the location and size (width and height) of the rectangle. Here is an example:
private void Exercise_Paint(object sender, PaintEventArgs e)
{
    Pen penCurrent = new Pen(Color.Coral, 11.528F);
    Rectangle Rect = new Rectangle(40, 40, 548, 226);

    e.Graphics.DrawRectangle(penCurrent, Rect);
}
This would produce:
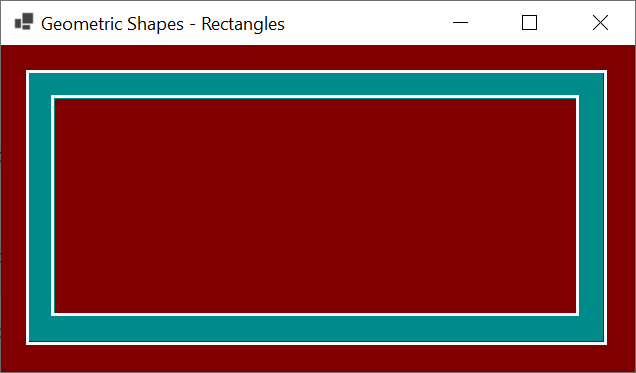
You can define the Pen and/or the Rectangle objects in the parentheses of the method. Here are examples:
private void Exercise_Paint(object sender, PaintEventArgs e)
{
    BackColor = Color.Maroon;

    e.Graphics.DrawRectangle(new Pen(Color.FromKnownColor(KnownColor.DarkCyan), 26.116F),
                             new Rectangle(40, 40, 548, 242));

    e.Graphics.DrawRectangle(new Pen(Color.FromKnownColor(KnownColor.GhostWhite), 2.093F),
                             new Rectangle(26, 26, 578, 272));

    e.Graphics.DrawRectangle(new Pen(Color.FromKnownColor(KnownColor.GhostWhite), 2.093F),
                             new Rectangle(51, 51, 525, 218));
}
This would produce:
The rectangle passed to the above Graphics.DrawRectangle() method uses integers. As an alternative, you may want a rectangle that uses decimal numbers. To support this, the Graphics class provides the following version of the Graphics.DrawRectangle() method:
public void DrawRectangle (System.Drawing.Pen pen, System.Drawing.RectangleF rect);
This time, pass the second argument with decimal numbers.
A Sized Rectangle
Instead of drawing the rectangle in a Rectangle object, you may want to explicitly specify the coordinates of the top-left corner and the size (width and height). As a reminder (from our introduction to graphics accessories), the rectangle can be illustrated as follows:
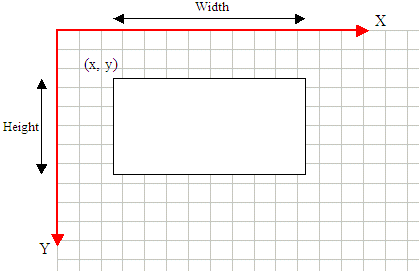
To support this, the Graphics class provides another version of the DrawRectangle() method. Its syntax is:
public void DrawRectangle(Pen pen,
                          int x,
                          int y,
                          int width,
                          int height);
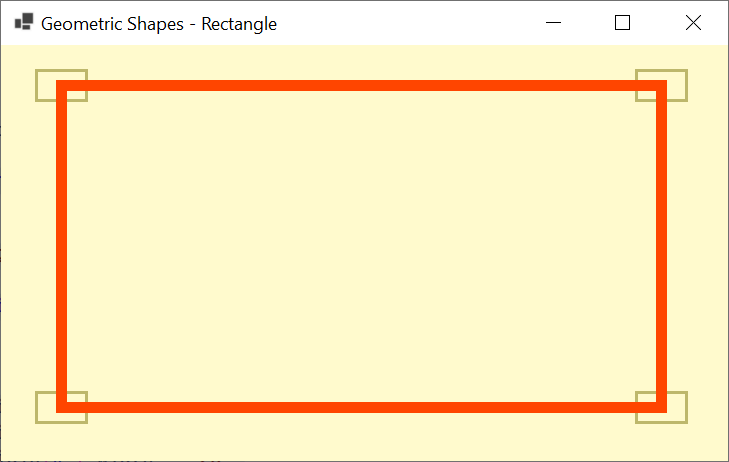
When calling this method, pass the coordinates of the top-left corner and the size of the rectangle. Here is an example:
private void Exercise_Paint(object sender, PaintEventArgs e)
{
    Pen penCurrent = new Pen(Color.OrangeRed, 11.528F);

    Point origin = new(60, 40);
    (int width, int height) = (600, 322);

    Pen pnRed = new Pen(Color.DarkKhaki, 2.50F);

    BackColor = Color.LemonChiffon;

    e.Graphics.DrawRectangle(pnRed, origin.X          - 25,
                                    origin.Y          - 15, 50, 30);
    e.Graphics.DrawRectangle(pnRed, origin.X + width  - 25,
                                    origin.Y          - 15, 50, 30);
    e.Graphics.DrawRectangle(pnRed, origin.X + width  - 25,
                                    origin.Y + height - 15, 50, 30);
    e.Graphics.DrawRectangle(pnRed, origin.X          - 25,
                                    origin.Y + height - 15, 50, 30);

    e.Graphics.DrawRectangle(penCurrent, origin.X, origin.Y, width, height);
}
This would produce:
If you prefer to use decimal values for the origin and the size of the rectangle, the Graphics class can assist you with the following version of the DrawRectangle() method:
public void DrawRectangle(Pen pen,
                          float x,
                          float y,
                          float width,
                          float height);
This time, pass the arguments as float values.
![]() Practical Learning: Drawing a Rectangle
Practical Learning: Drawing a Rectangle
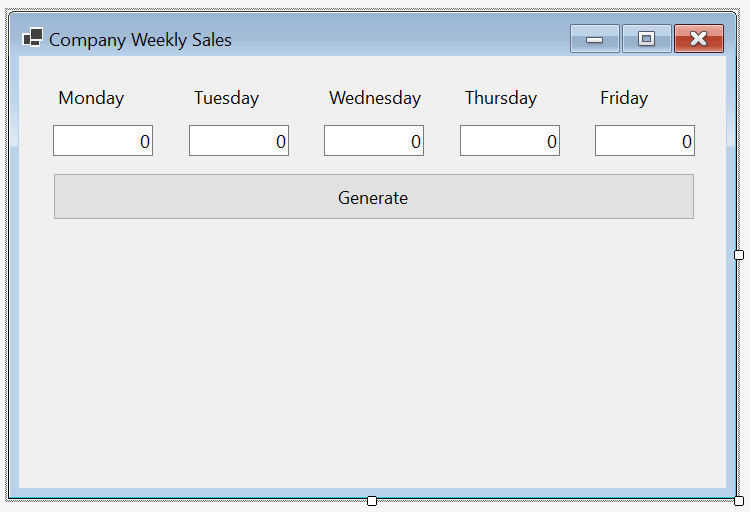
| Control | Name | Text | |
| Label | Monday | ||
| Label | Tuesday | ||
| Label | Wednesday | ||
| Label | Thursday | ||
| Label | Friday | ||
| TextBox | txtMonday | 0 | |
| TextBox | txtTuesday | 0 | |
| TextBox | txtWednesday | 0 | |
| TextBox | txtThursday | 0 | |
| TextBox | txtFriday | 0 | |
| Button | Generate | btnGenerate | |
namespace WeeklySales1
{
    public partial class Exercise : Form
    {
        public Exercise()
        {
            InitializeComponent();
        }

        private void btnGenerate_Click(object sender, EventArgs e)
        {
                int monday    = 0,
                tuesday   = 0,
                wednesday = 0,
                thursday  = 0,
                friday    = 0;

            try
            {
                monday = int.Parse(txtMonday.Text) / 100;
            }
            catch (FormatException)
            {
                MessageBox.Show("Invalid sales on Monday");
                txtMonday.Text = "0";
            }

            try
            {
                tuesday = int.Parse(txtTuesday.Text) / 100;
            }
            catch (FormatException)
            {
                MessageBox.Show("Invalid sales on Tuesday");
                txtTuesday.Text = "0";
            }

            try
            {
                wednesday = int.Parse(txtWednesday.Text) / 100;
            }
            catch (FormatException)
            {
                MessageBox.Show("Invalid sales on Wednesday");
                txtWednesday.Text = "0";
            }

            try
            {
                thursday = int.Parse(txtThursday.Text) / 100;
            }
            catch (FormatException)
            {
                MessageBox.Show("Invalid sales on Thursday");
                txtThursday.Text = "0";
            }

            try
            {
                friday = int.Parse(txtFriday.Text) / 100;
            }
            catch (FormatException)
            {
                MessageBox.Show("Invalid sales on Friday");
                txtFriday.Text = "0";
            }

            graphDrawingArea!.Clear(BackColor);

            int bottomLine = 400;

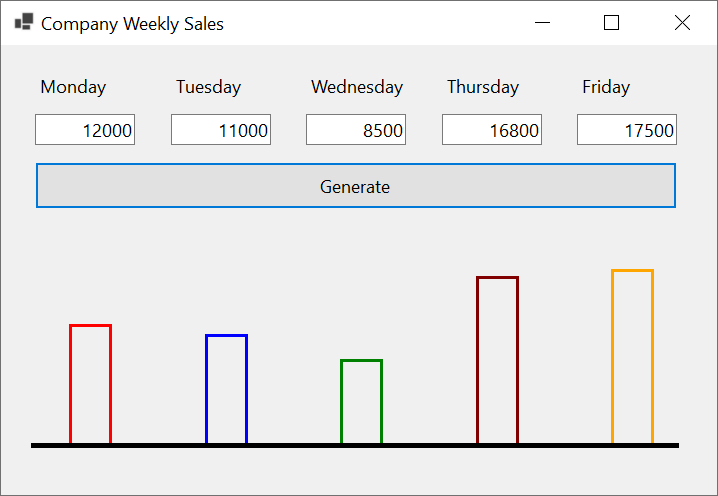
            CreateGraphics().DrawRectangle(     new Pen(Color.Red, 3.00F),                  txtMonday.Left    + 35, bottomLine - monday,    40, monday);
            CreateGraphics().DrawRectangle(pen: new Pen(Color.Blue, width: 3.00F),          txtTuesday.Left   + 35, bottomLine - tuesday,   40, tuesday);
            CreateGraphics().DrawRectangle(     new Pen(color: Color.Green, width: 3.00F),  txtWednesday.Left + 35, bottomLine - wednesday, 40, wednesday);
            CreateGraphics().DrawRectangle(pen: new Pen(width: 3.00F, color: Color.Maroon), txtThursday.Left  + 35, bottomLine - thursday,  40, thursday);
            CreateGraphics().DrawRectangle(     new Pen(width: 3.00F, color: Color.Orange), txtFriday.Left    + 35, bottomLine - friday,    40, friday);

            CreateGraphics().DrawLine(new Pen(Color.Black, 5.00F), 30, bottomLine, Width - 60, bottomLine);
        }
    }
}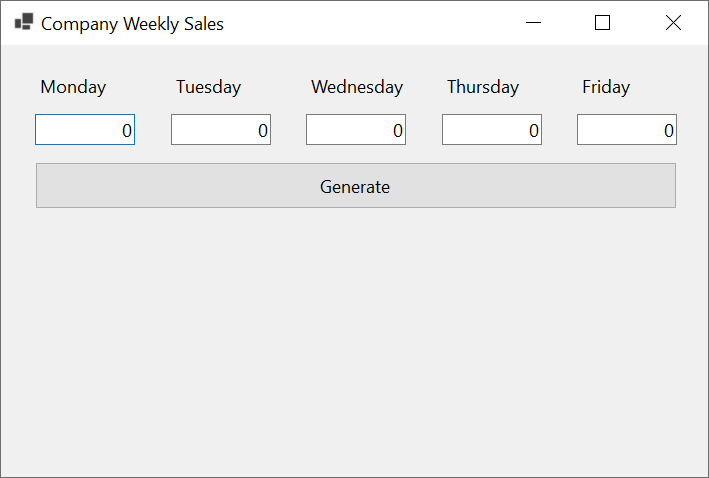
Monday:    12000
Tuesday:   11000
Wednesday:  8500
Thursday:  16800
Friday:    17500
A Series of Rectangles
The DrawRectangle() method is used to draw one rectangle. If you need to draw many rectangles, you can call the DrawRectangle() method as many times as you want and specify a pen with a color for each rectangle. On the other hand, if you plan to draw many rectangles that use the same pen and consequently the same color, to assist you, the Graphics class provides an overloaded method named DrawRectangles. It comes in two versions whose syntaxes are:
public void DrawRectangles(Pen pen, Rectangle[] rects);
public void DrawRectangles(Pen pen, RectangleF[] rects);
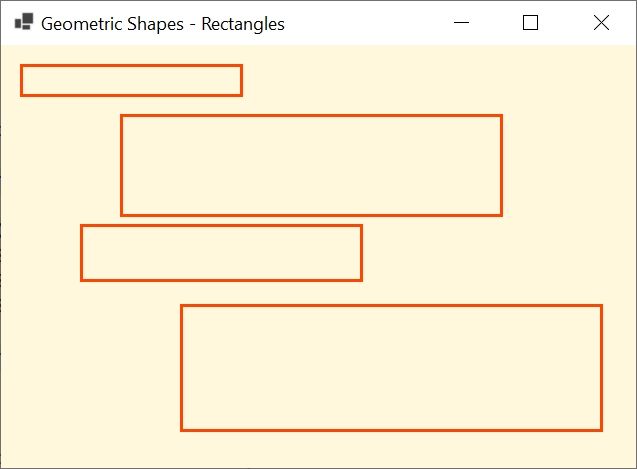
This method requires an array of Rectangle or RectangleF values. When executed, it draws individual rectangles using each member of the array as its own rectangle. Here is an example:
private void Exercise_Paint(object sender, PaintEventArgs e)
{
    Pen penCurrent = new Pen(Color.OrangeRed, 3.528F);

    Rectangle[] Rect = { new Rectangle( 20,  20, 220, 30),
                         new Rectangle(120,  70, 380, 100),
                         new Rectangle(80,  180, 280, 55),
                         new Rectangle(180, 260, 420, 125) };

    e.Graphics.DrawRectangles(penCurrent, Rect);

    BackColor = Color.Cornsilk;
}
This would produce:
Squares
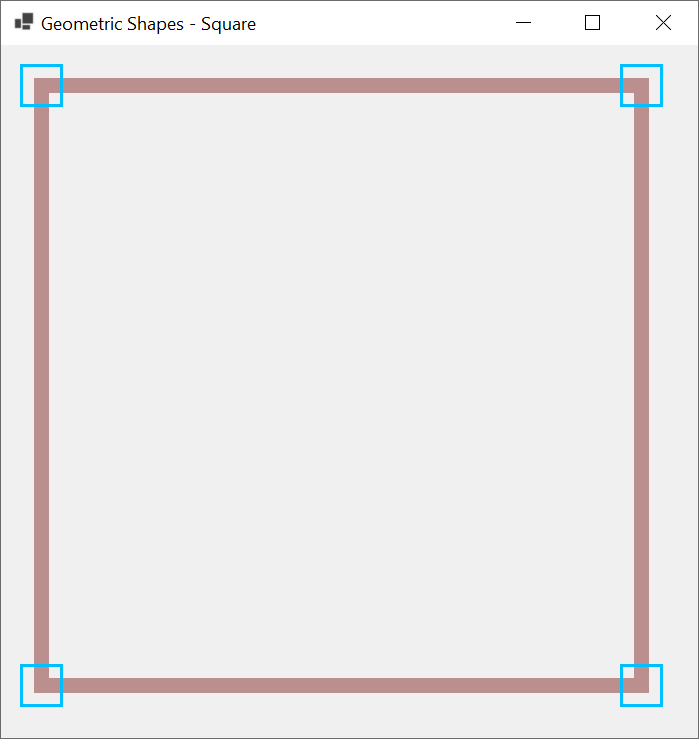
A square is a type of rectangle where all four sides have the same value. To draw a square, you can call one of the Graphics.DrawRectangle() method but specifying the same value for the width and the height. Here is an example:
private void Exercise_Paint(object sender, PaintEventArgs e)
{
    Pen penMarker = new Pen(Color.DeepSkyBlue, 2.50F);
    Pen penCurrent = new Pen(Color.RosyBrown, 14.50F);

    int side = 600;
    Point origin = new(40, 40);
    Rectangle rect = new Rectangle(origin.X, origin.Y, side, side);

    e.Graphics.DrawRectangle(penCurrent, rect);

    e.Graphics.DrawRectangle(penMarker, origin.X              - 20, origin.Y               - 20, 40, 40);
    e.Graphics.DrawRectangle(penMarker, origin.X + rect.Width - 20, origin.Y               - 20, 40, 40);
    e.Graphics.DrawRectangle(penMarker, origin.X              - 20, origin.Y + rect.Height - 20, 40, 40);
    e.Graphics.DrawRectangle(penMarker, origin.X + rect.Width - 20, origin.Y + rect.Height - 20, 40, 40);
}
This would produce:
![]() Practical Learning: Ending the Lesson
Practical Learning: Ending the Lesson
|
|
|||
| Previous | Copyright © 2010-2024, FunctionX | Tuesday 07 May 2024 | Next |
|
|
|||